The West Ward is marginalized in a plethora of ways including a lack of education, income, and transportation. This all contributes to the issue of the food dessert. This page examines some of the systematic and institutional obstacles faced by those in the West Ward and how they contribute to the food desert.
Education
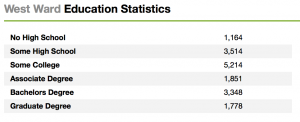
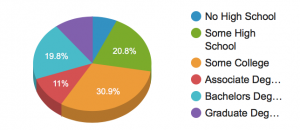
The West West Ward is an under educated community, this is clear because 1,164 residents, or 6.9% of the population has not been educated past eighth grade. The data also shows that there are more residents with some high school than residents with a Bachelors degree as their highest level of education. To add to this issue, the West Ward public schools are graded as a 55/100 when the national average is 61/100. This implies the residents within the West Ward may not have access to information about healthy eating habits. Therefore, the residents are more likely to buy junk food. This demand for unhealthy food causes shop owners to be resistant to initiatives that seek to put fresh produce on their shelves.
Income
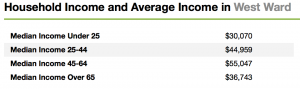
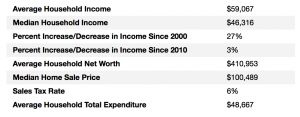
Within the West Ward there is an Income gap. This is clear because the median household income is lower in the West Ward than it is in the U.S. or Pennsylvania. The median income in the West Ward is also less than the average household income in the West Ward. This indicates that there are more outliers of high income than low income.
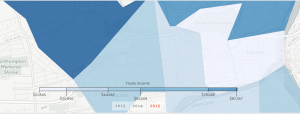
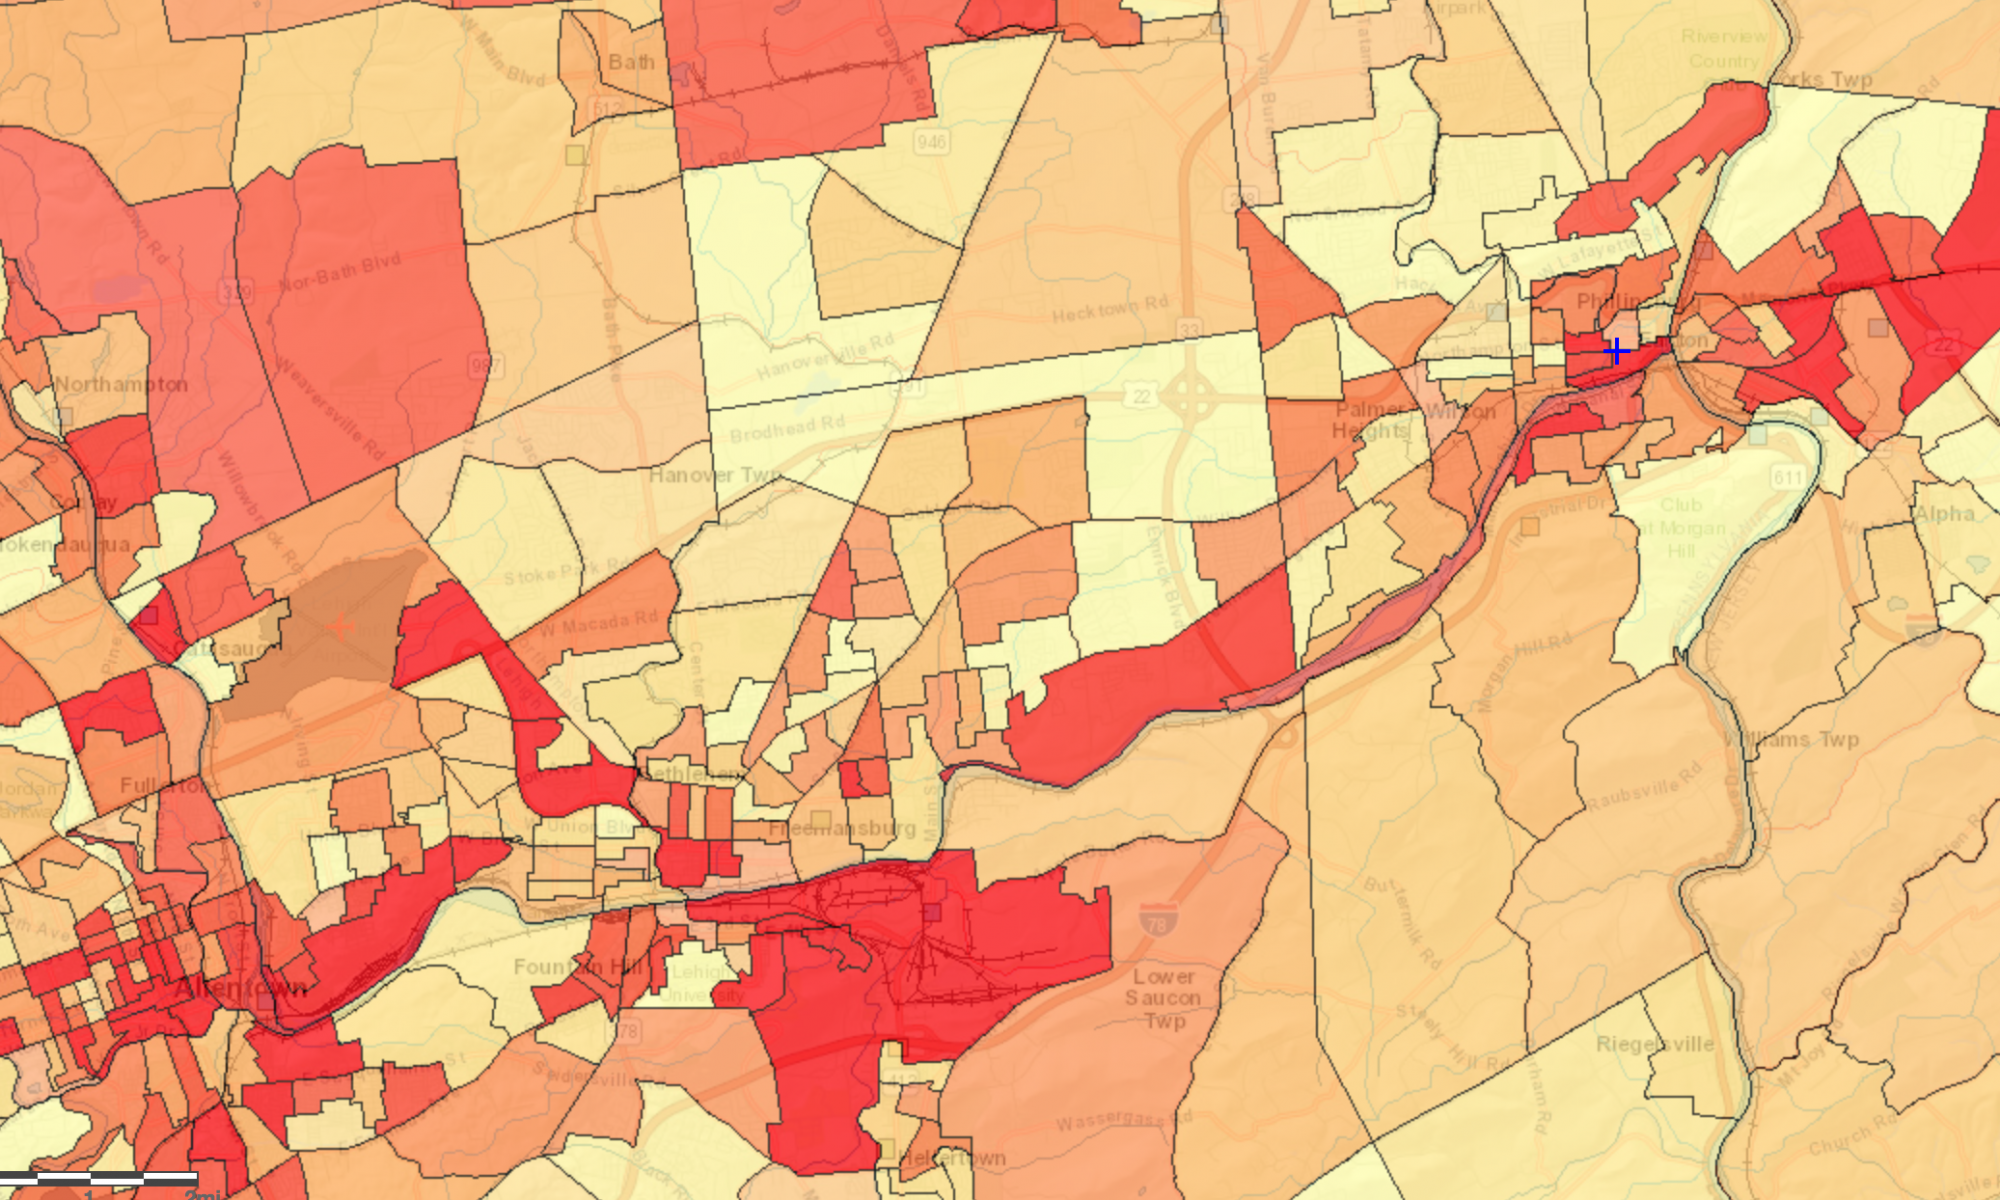
As you can see the West Ward is the area with two of the lowest Median yearly Income tracts. The slightly darker, western area of the West Ward has a median income of $33,453 and the lighter, eastern side of the West Ward has a median income of $25,645. The income gap is related to the food desert because fresh, local, organic food is more expensive and households with less expendable income may not be able to afford healthier food. This adds to the supply/demand issue previously stated with the education gap.
Transportation
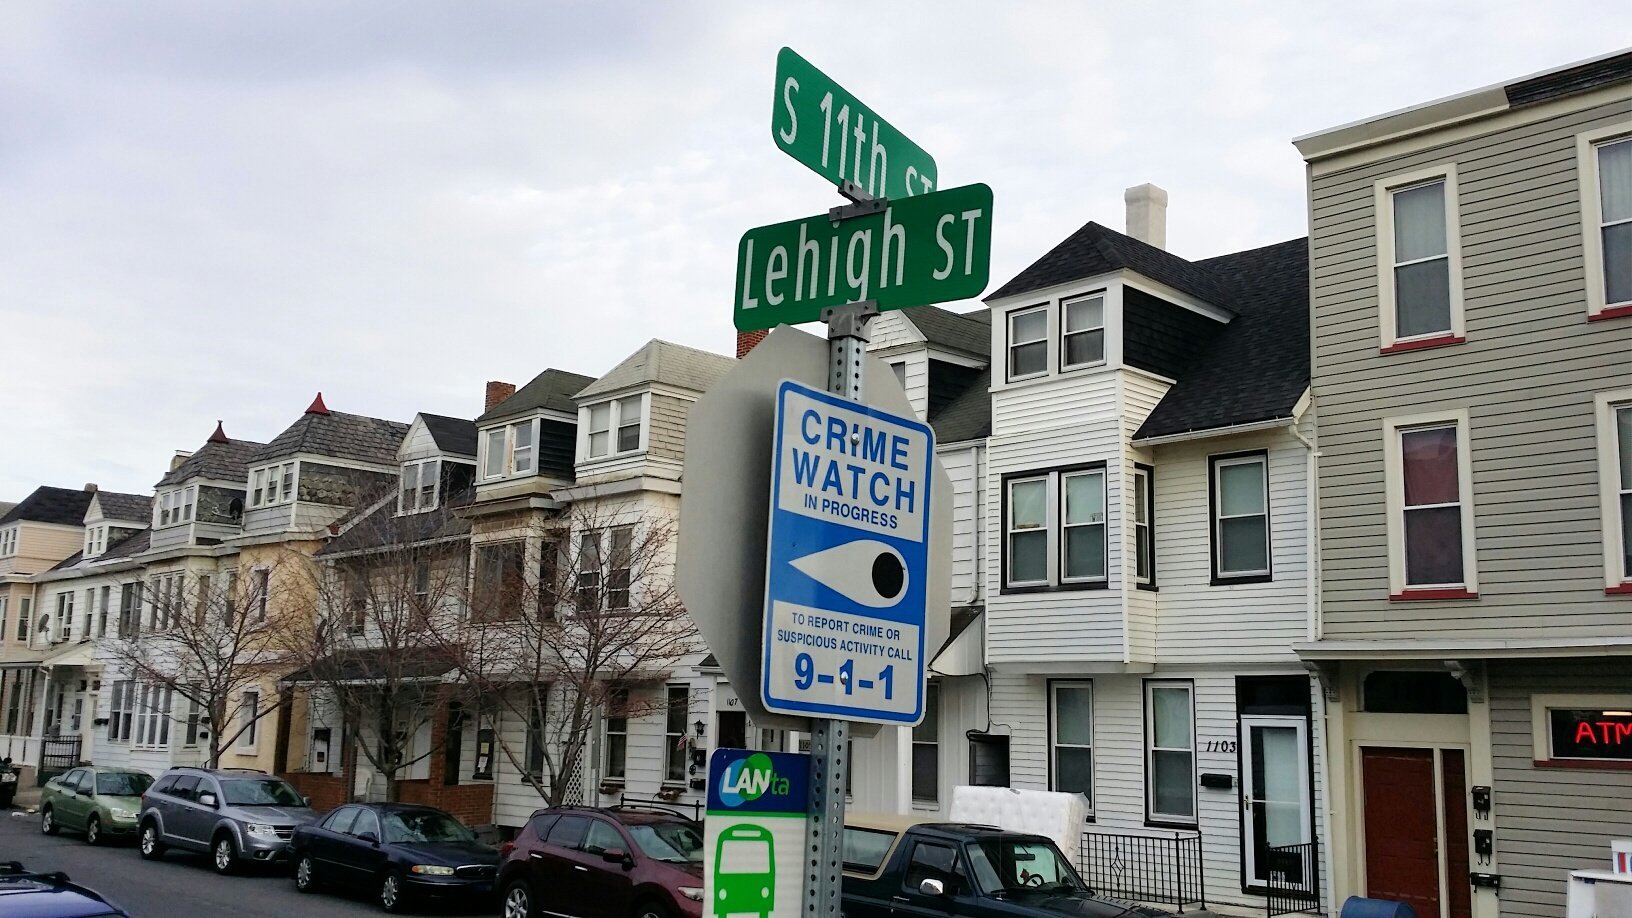
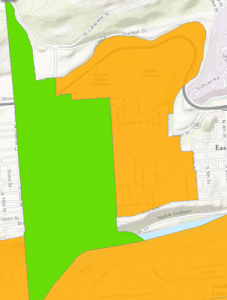
The purple shows tracts in which more than 100 households have no access to a vehicle and are more than ½ mile from the nearest supermarket. As you can see the West Ward is completely encompassed as a transportation gap. This adds to the injustices faced by this community, without individual transportation, residents must rely on costly taxis, or the Lanta bus that costs $2.00 per ride to access a supermarket with fresh produce.
Food
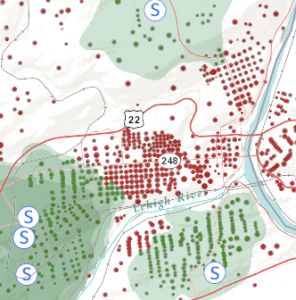
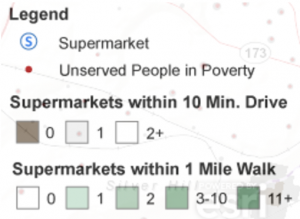
Both maps illustrate the food desert experienced by those in the West Ward. The second map also illustrates the income gap because the West Ward is the area of Easton with the most dense population of people in poverty. The education gap, income gap, transportation gap, and food dessert all come together in a perfect storm to disenfranchise a community.