Dr. Mónica Salas-Landa, Assistant Professor of Anthropology
Dr. Mónica Salas-Landa used a Digital Humanities in the Classroom Grant to develop a class project in her Spring 2017 course “Anthropology & Sociology 201: Environment and Culture.” Read on for her reflections on the semester!
How can we understand the many ways in which people shape their environments and are, in turn, shaped by them? Although this basic question might be an expected centerpiece of a 200-level course titled “Environment and Culture,” my class last spring invited students to engage with this line of inquiry in the most direct and substantial way possible: across the semester, students developed research projects on a local landscape in Easton and made an argument about the nature-human dynamics that they encountered there. They drew on ethnographic and historical methods in order to analyze their chosen landscape and participate in relevant scholarly debates, which we discussed in class. The goal of this assignment, then, was not only for students to gain experience “reading” an actual landscape but also for them to develop a more robust understanding of how their own existence at this time and place is inextricably connected to other complex relationships between humans and their environment.
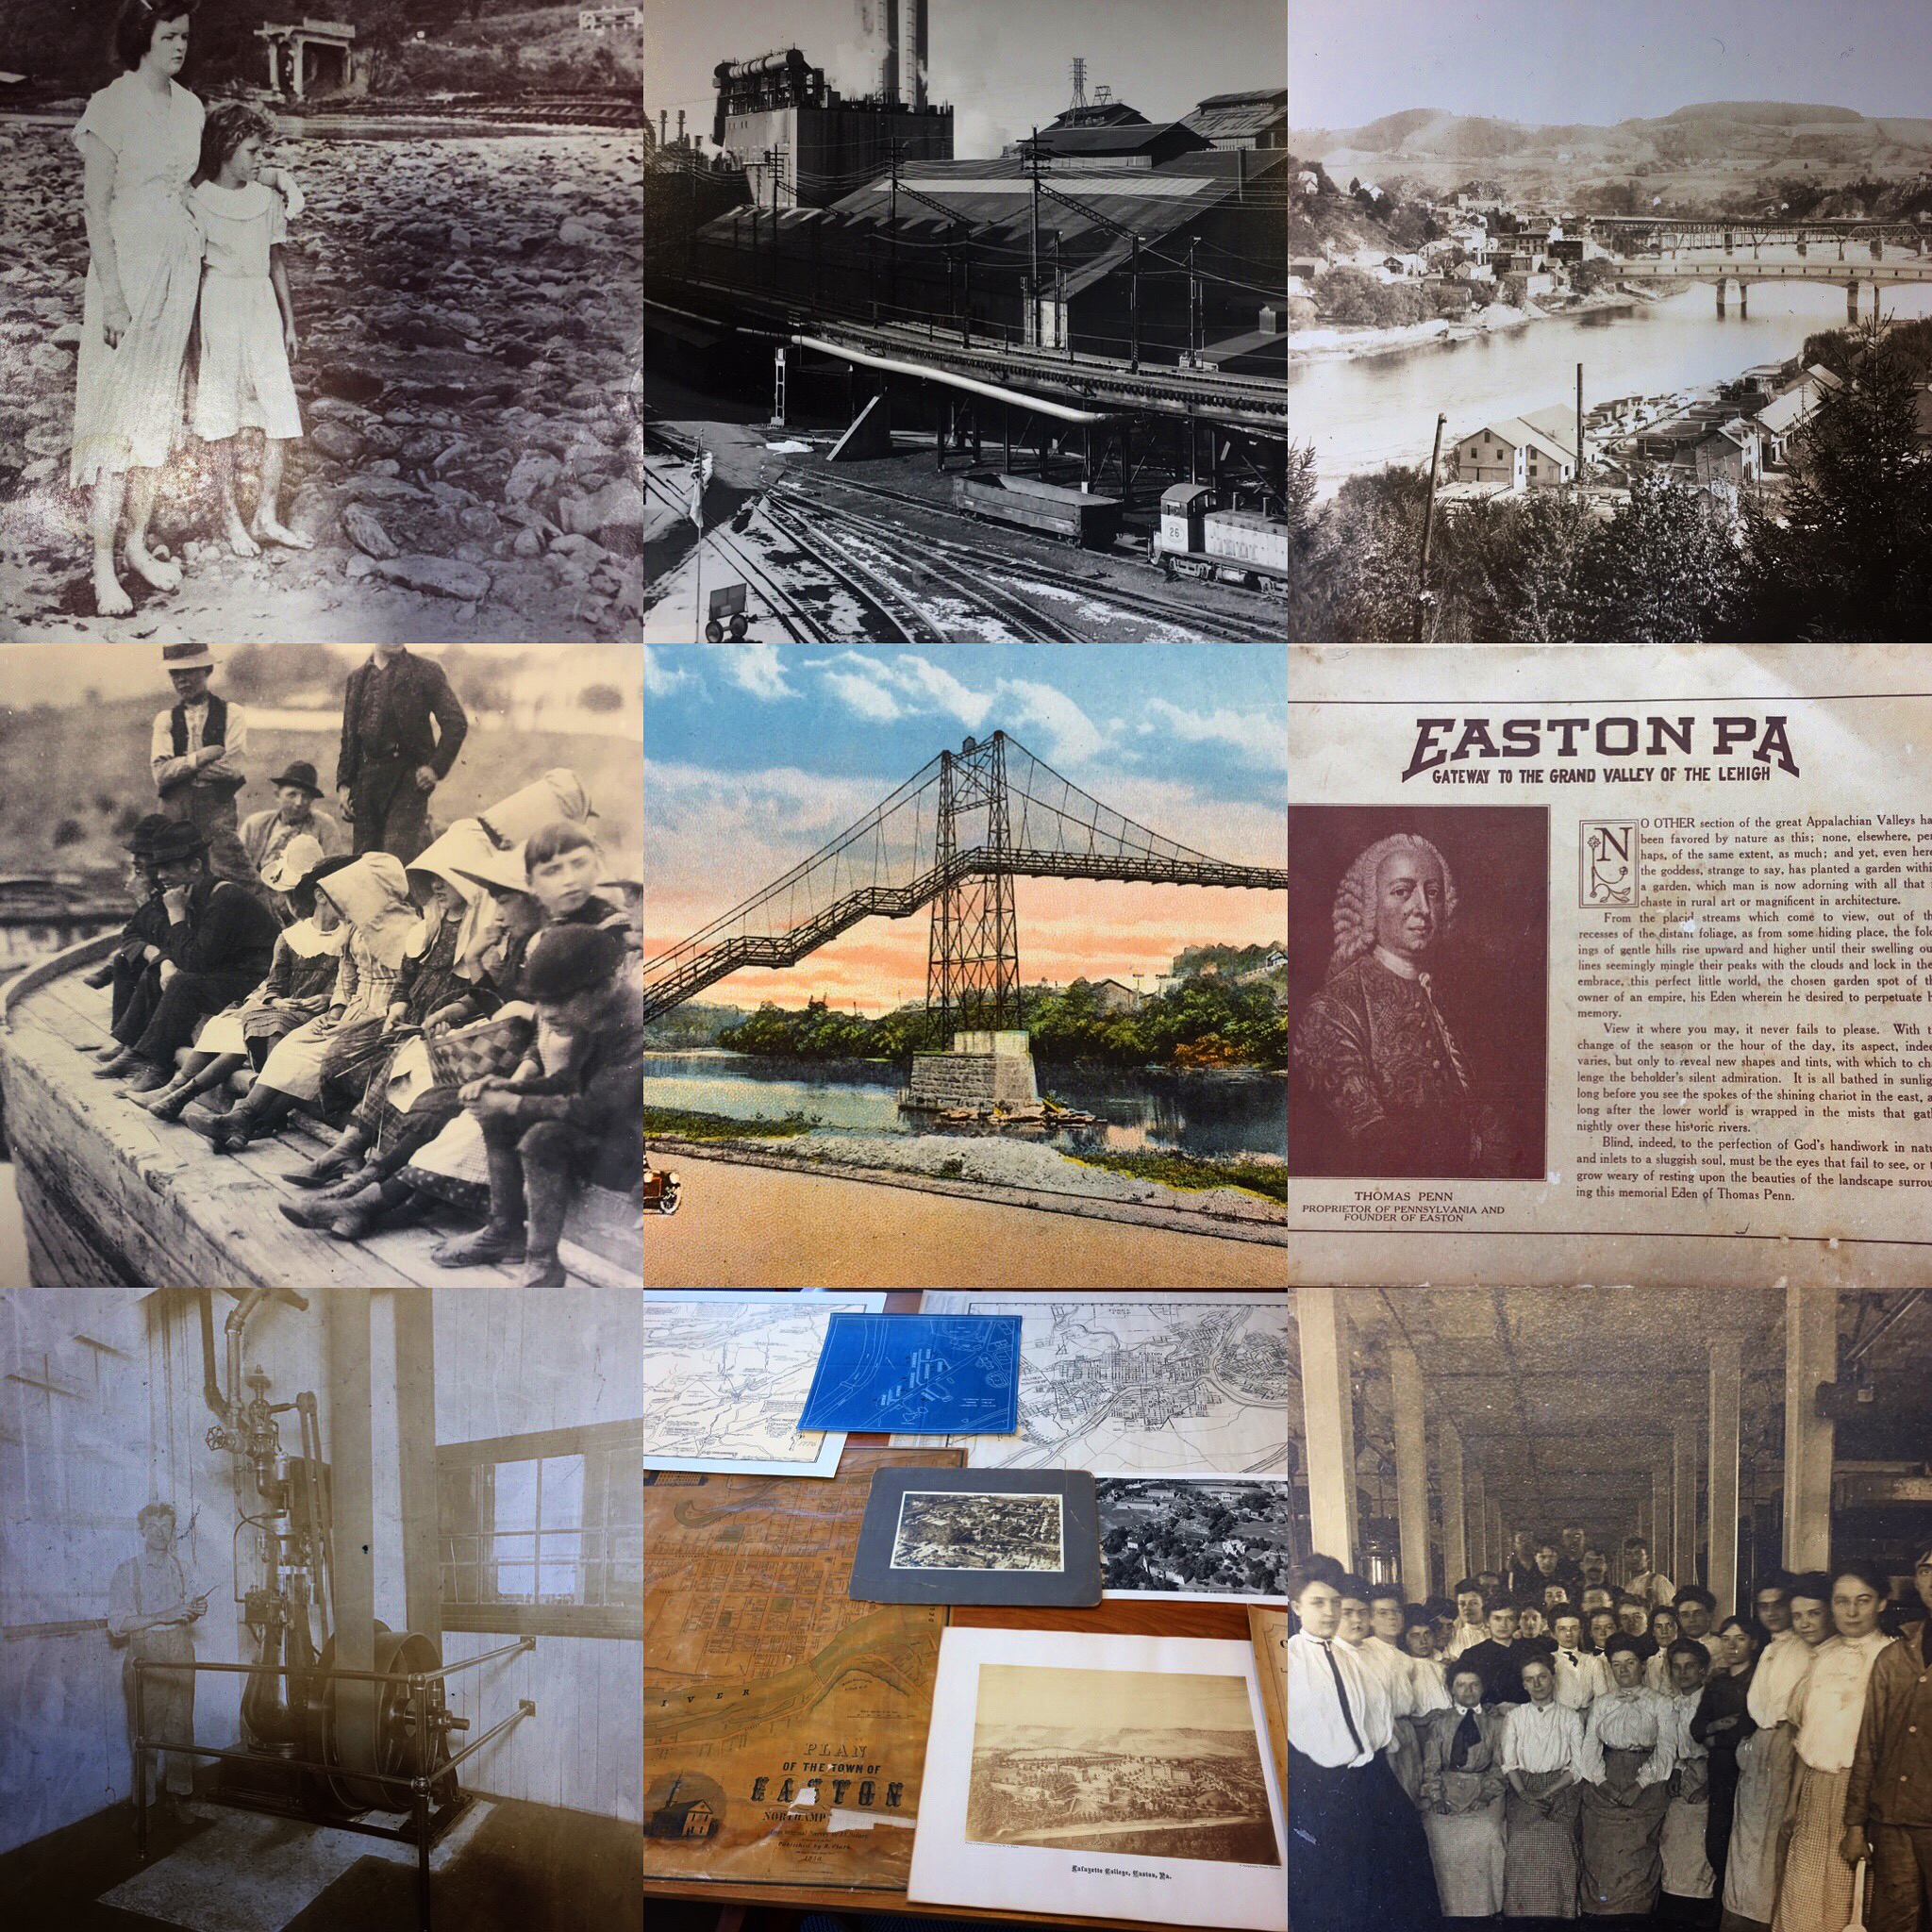
A variety of images students encountered in their primary source research for the class Omeka project
Students’ ethnographically and historically informed research, moreover, served as the basis for a collective class project: the development of a digital collection and exhibition based on material connected to everything from local dams, industrial parks, and cemeteries to roads, community parks, and food markets. During their research, each student collected, on the one hand, an image, sound recording, or video of their field site and related it to a piece of historical evidence, which they found in Lafayette Special Collections & College Archives or at the Easton Public Library. Using Omeka, a web-publishing platform for displaying archives, collections, and exhibitions, students catalogued their material, entered metadata, and created an exhibit page in which they further explored the relationship between concepts discussed in class and assemblies of items from our collection.
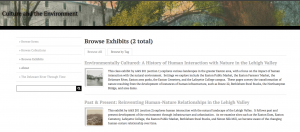
The A&S 201 Omeka site
By incorporating a digital humanities component into this class, I was able to introduce students to ethnographic and historical research of primary sources as well as the critical thinking involved in creating an archive. Through the selection, organization, cataloguing, and analysis of a myriad of documents, photographs, sound recordings, and videos of the Easton area, students connected their own research to wider theoretical issues about how representations of nature are constructed and disseminated. The site, which remains a work in progress, can be viewed here.
Further, drawing on the digital humanities in this course has also helped me to imagine ways of expanding and sharing my own research results on environmental degradation in oil zones in Mexico. I hope to use Omeka to develop a public “toxic archive” in which community members can document and record the harmful presences of oil and its infrastructure. In a context where the invisibility of toxicity works to mask or deny it, rendering its noxious effects visible is of utmost importance.