
Dr. Lindsay Soh, Assistant Professor of Chemical and Biomolecular Engineering
Dr. Lindsay Soh used a Digital Humanities in the Classroom Grant to develop a class project in her Spring 2017 course “Chemical Engineering 370: Alternative Energy Sources.” In this course students are introduced to how to compare different energy technologies based on a number of different metrics. Read on for her reflections on the semester!
The idea of my Digital Humanities in the Classroom project was to communicate how an energy technology works to the general community and allow for greater understanding of the course metrics using data visualization. Specifically, the students’ project involved research into a chosen renewable energy technology.
The students first underwent literature-based research to understand the technology’s fundamentals. Next, they were asked to find and interpret data related to the technology in order to gain a deeper understanding of the feasibility of the energy source. The project consisted of a comprehensive report of the renewable energy technology that also incorporated how to communicate the findings with the general community. As such, the digital project included a visualization of the major findings that could be expounded from the data set and as related to the course metrics.
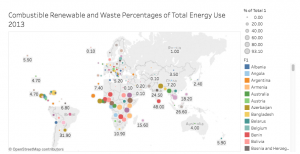
A data visualization created by Dr. Soh’s students on Tableau
Using the data analytics platform Tableau, students created public sites that provided a context and story for the visualization. This resource is being made available to the Nurture Nature Center as a possible tool for their energy education program, and the public sites are also being posted on the my website.
Throughout the course, the concept of visualizing and interpreting data was discussed several times along with discussion and analysis. Furthermore, in collaboration with librarian Sarah Morris, the DH training consisted of several targeted sessions that sought to answer the following questions with the students
- Why is data visualization important?
- How to find and build data sets?
- How to use Tableau software for the final project visualization?
Upon reflection, I think that the integration of DH aspects into the course was largely successful. It has been my goal since coming to Lafayette College to provide students with the tools necessary to better communicate fact-based arguments. This project has served multiple purposes, allowing the students to explore a particular research question as well as develop ways to use data to explore a novel research question and communicate the findings.
The basic structure of the project worked well for these goals, however one shortcoming became apparent in the final products – the students were not able to utilize the data visualization software to its full abilities. For example, while the graphics that students produced were visually appealing, they were limited mostly to two variable comparisons; the beauty of data visualization is in the ability to elegantly intersect 3 or more variables to tell a different the of story with the data. I think that adding an extra deliverable would aid in this objective.