An issue facing many renewable energy technologies is the initial cost associated with their implementation. While the infrastructure for fossil fuel energy is already well established, the design and construction of solar thermal technologies may require large amounts of upfront capital. To fully understand the economic benefits of renewable energy, a life-cycle cost-benefit analysis must be considered.
From the perspective of a consumer, solar thermal technology is not economically feasible unless it can offer an alternative to the existing energy infrastructure at a lower life-cycle cost. Savings-to-investment ratios, payback times, and equivalent electricity rates are three ways in which a solar thermal technology could be evaluated economically. The savings-to-investment ratio (SIR) compares the potential savings generated by a technology to its initial investment costs. The payback time is the estimated period in which a technology would “pay for itself” based on the savings generated. Finally, the equivalent electricity rate is presented as the consumer’s cost per electrical energy for which using a solar thermal alternative would be be economically identical.
The Federal Energy Management Program, a program within the National Renewable Energy Laboratory, combines solar radiation data with upfront costs, existing electricity rates, and government incentives to give location-specific SIRs, payback times, and equivalent electricity rates for photovoltaic and solar thermal technology. These maps can be useful for consumers interested in the feasibility of these technologies at a local or national level. The image below shows a map of the continental United States demonstrating the range of payback times for flat plate and evacuated tube solar water heaters.
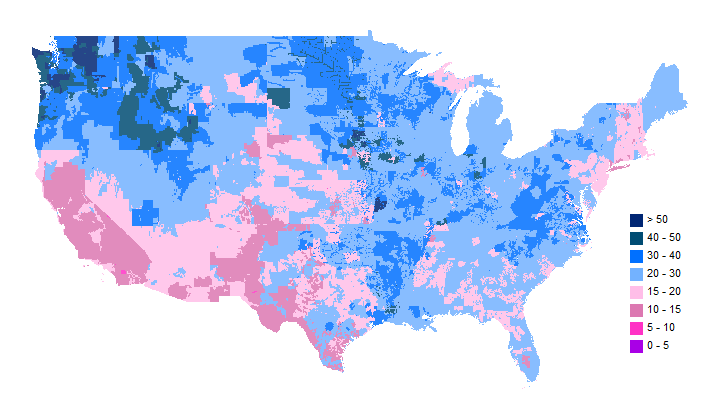
Payback times for solar water heaters (FEMP)
Predictably, the Southwest has the lowest estimated payback time with some areas seeing their investment paid back in 5-10 years. Since these models account for detailed region-specific costs, areas in the Northeast and the northern Midwest can also see payback times as low as 10-15 years. At worst, locations largely in the Pacific Northwest would potentially see payback times longer than 50 years.
These maps help illustrate the idea that investing energy technology like solar thermal can be an economically sound choice for many companies and individuals. Ultimately, the increased access to costs and benefits information will contribute to more accurate analyses, better investment decisions in renewable energy, and a step towards a sustainable energy infrastructure.
Authored by: Sam Brinton
Edited By: Chris Castello