
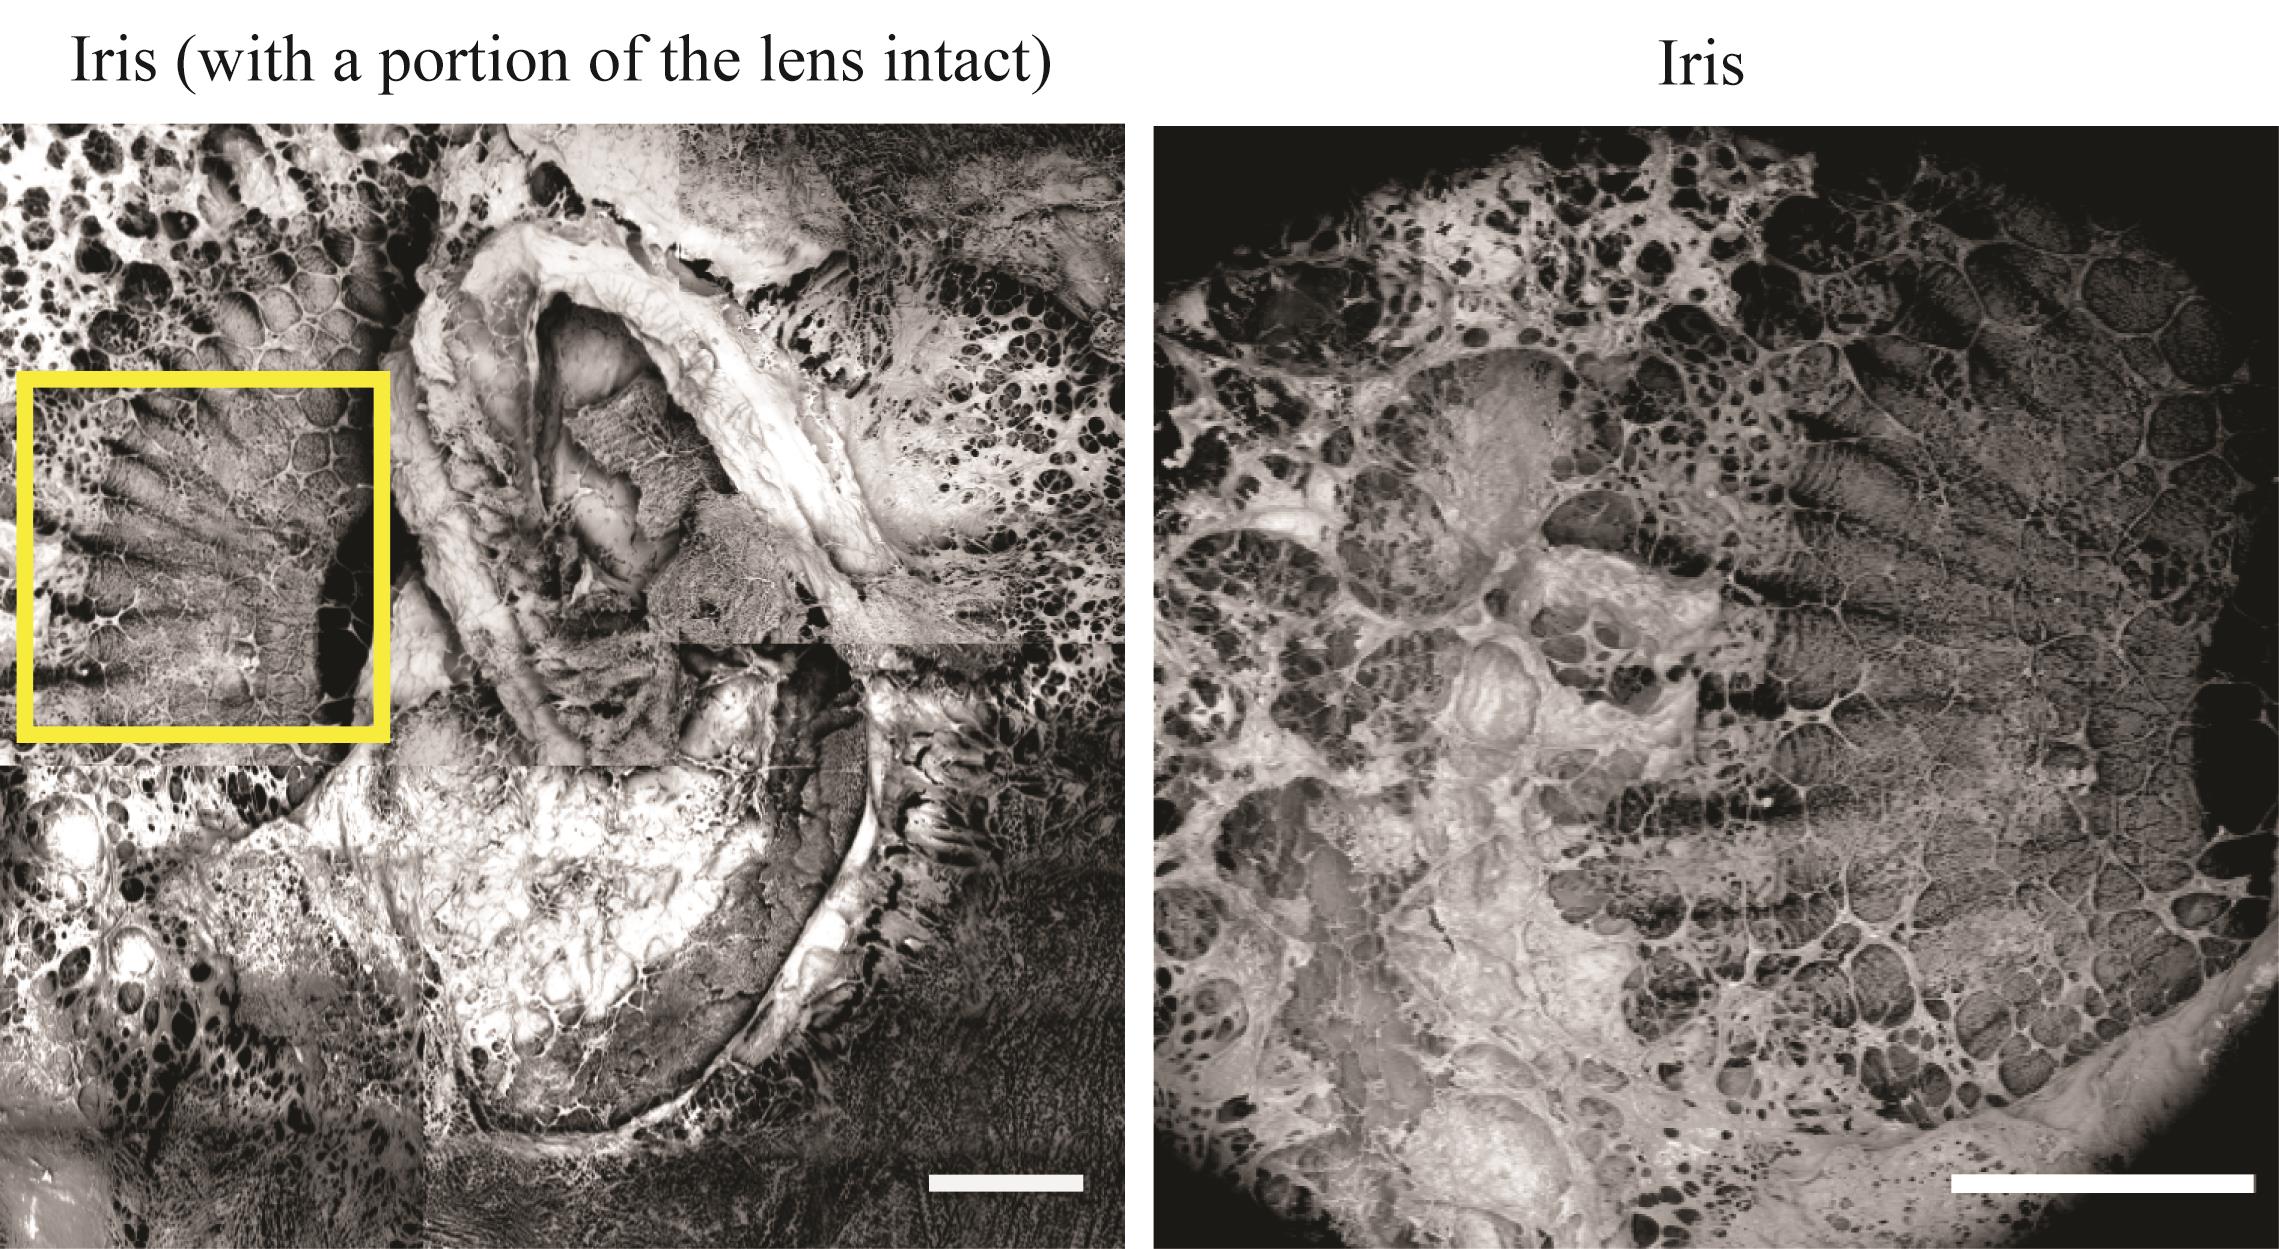
Figure 1: Inner surface of eye cup obtained by Phenom Pro X scanning electron microscope
- Lens of eye was dissected and removed from part of the eyecup in the temporal region of the eye, so the iris could be seen more clearly
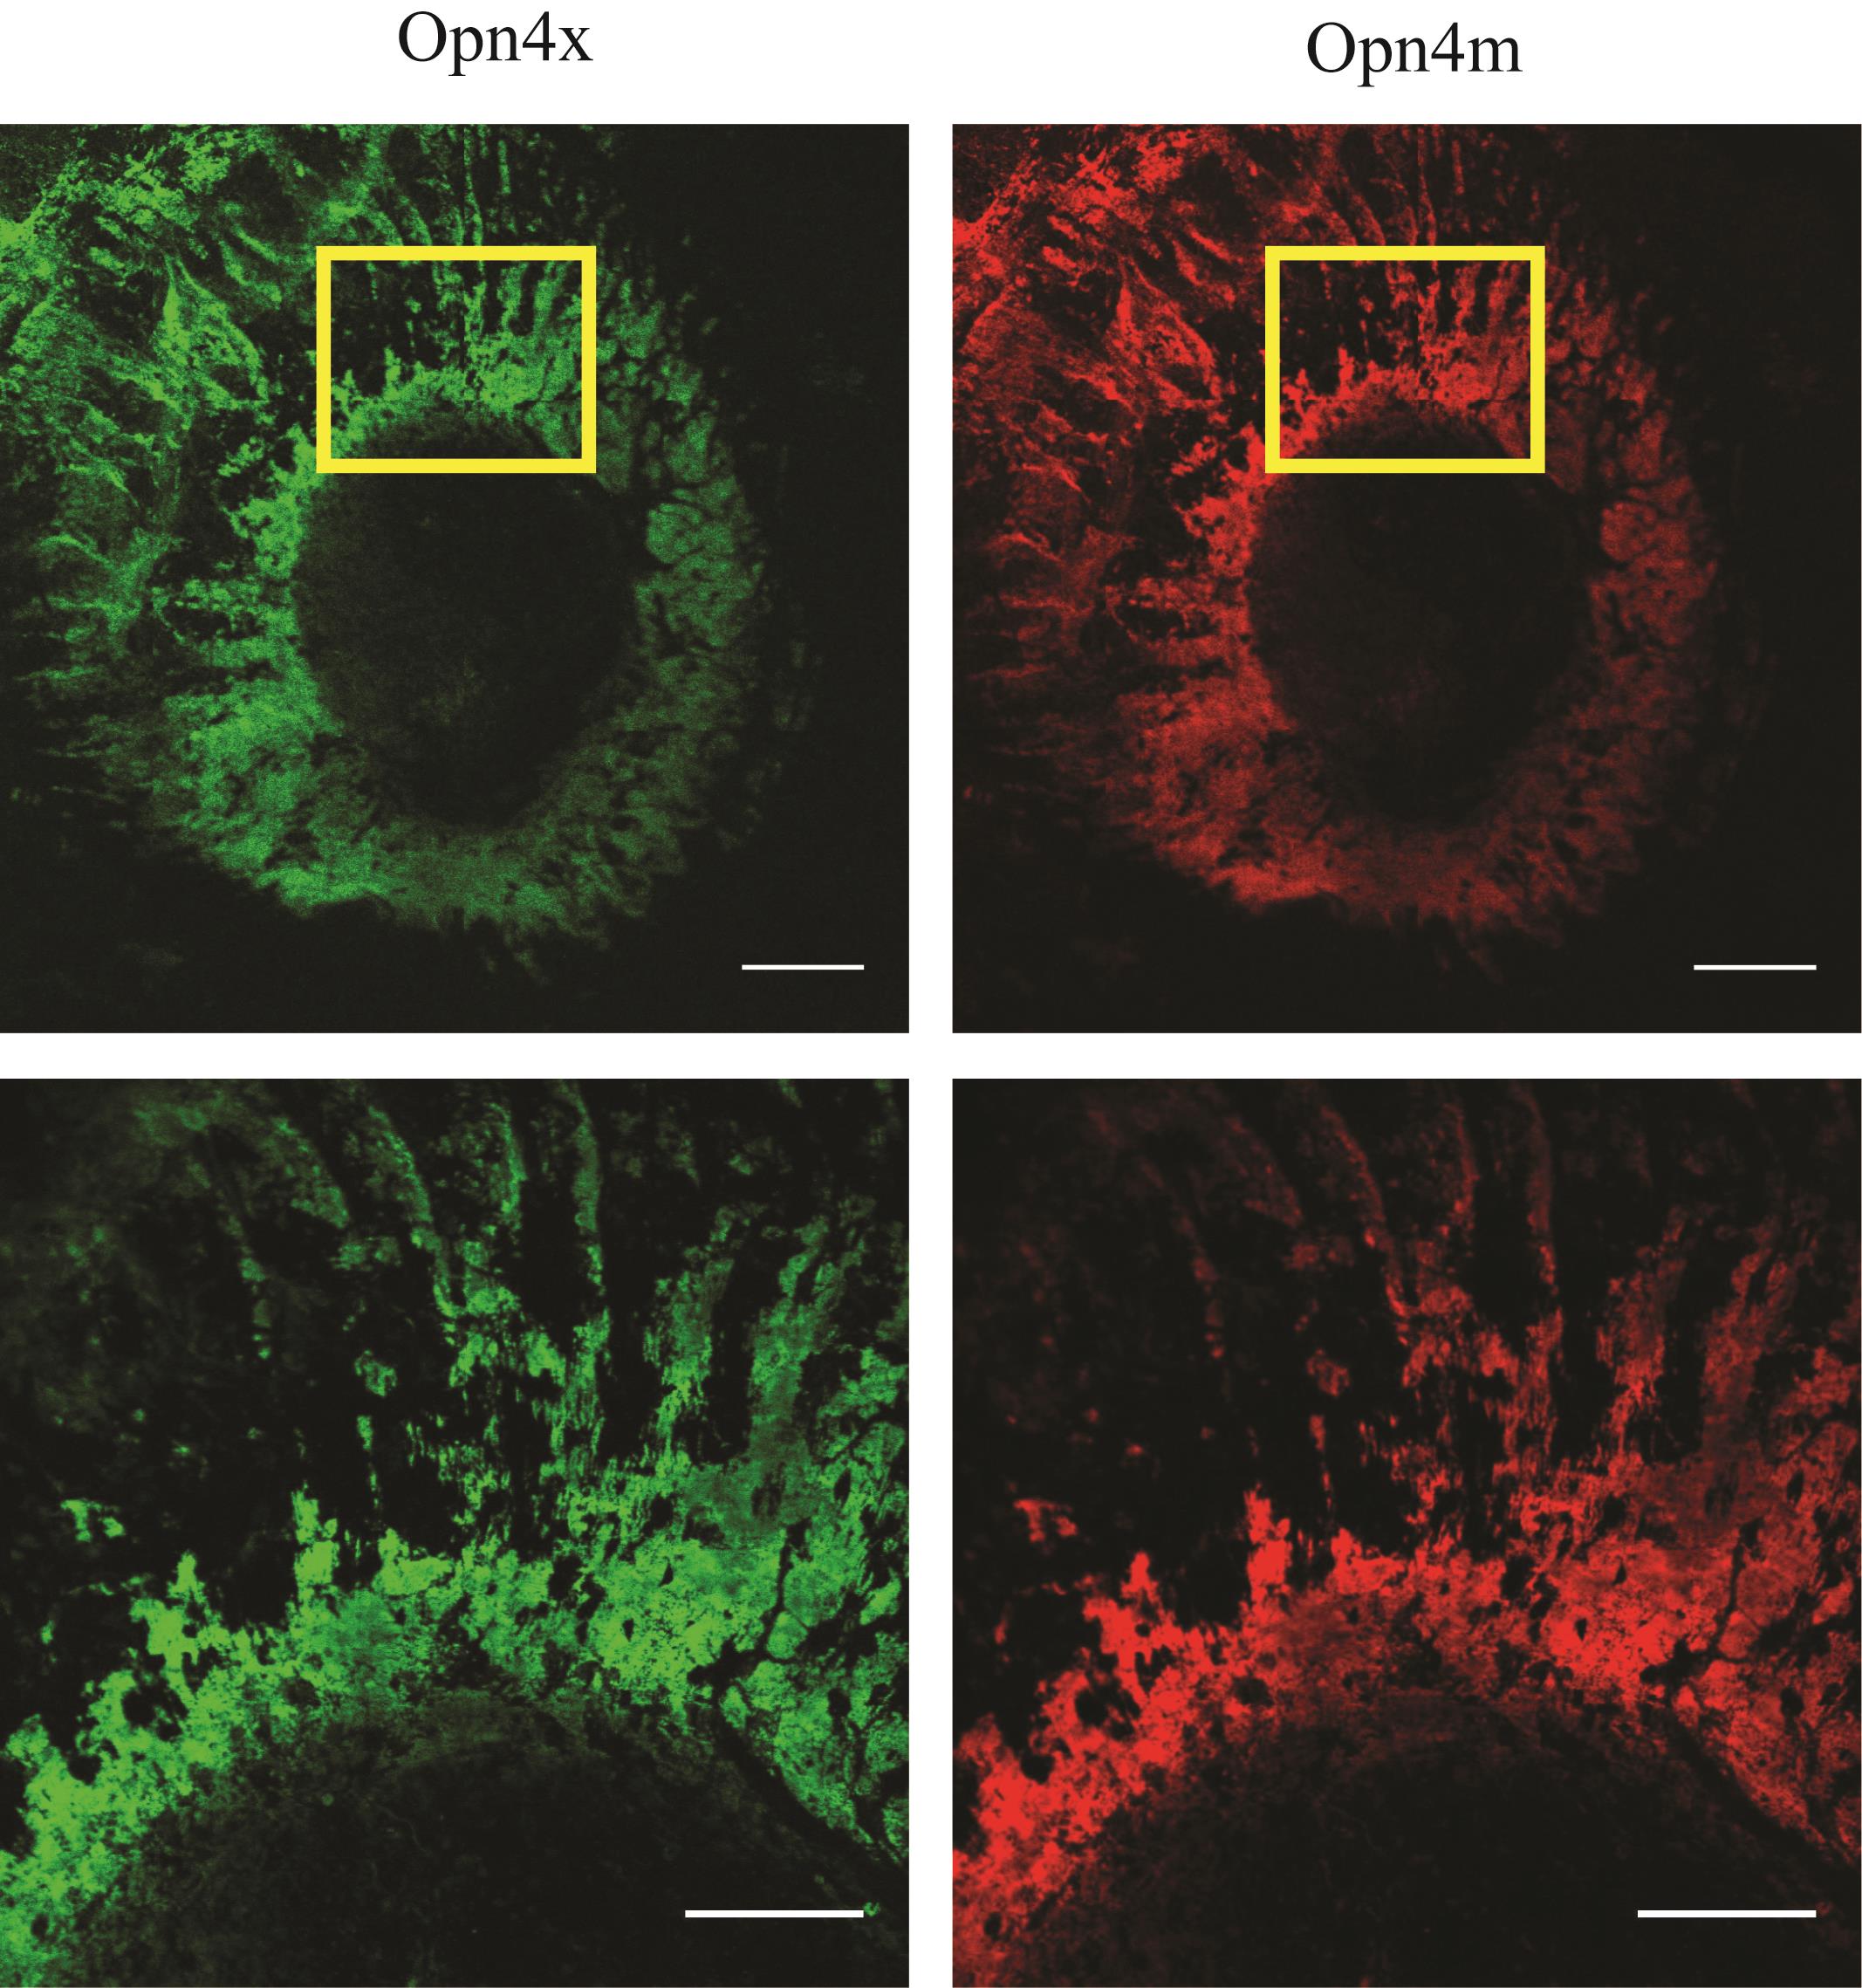
Figure 2: Images from the iris were treated with antisense probes
- Images were captured using an Olympus FV10i confocal microscope
- Bottom row of images: Magnified views of dorsal regions of inner portions of iris
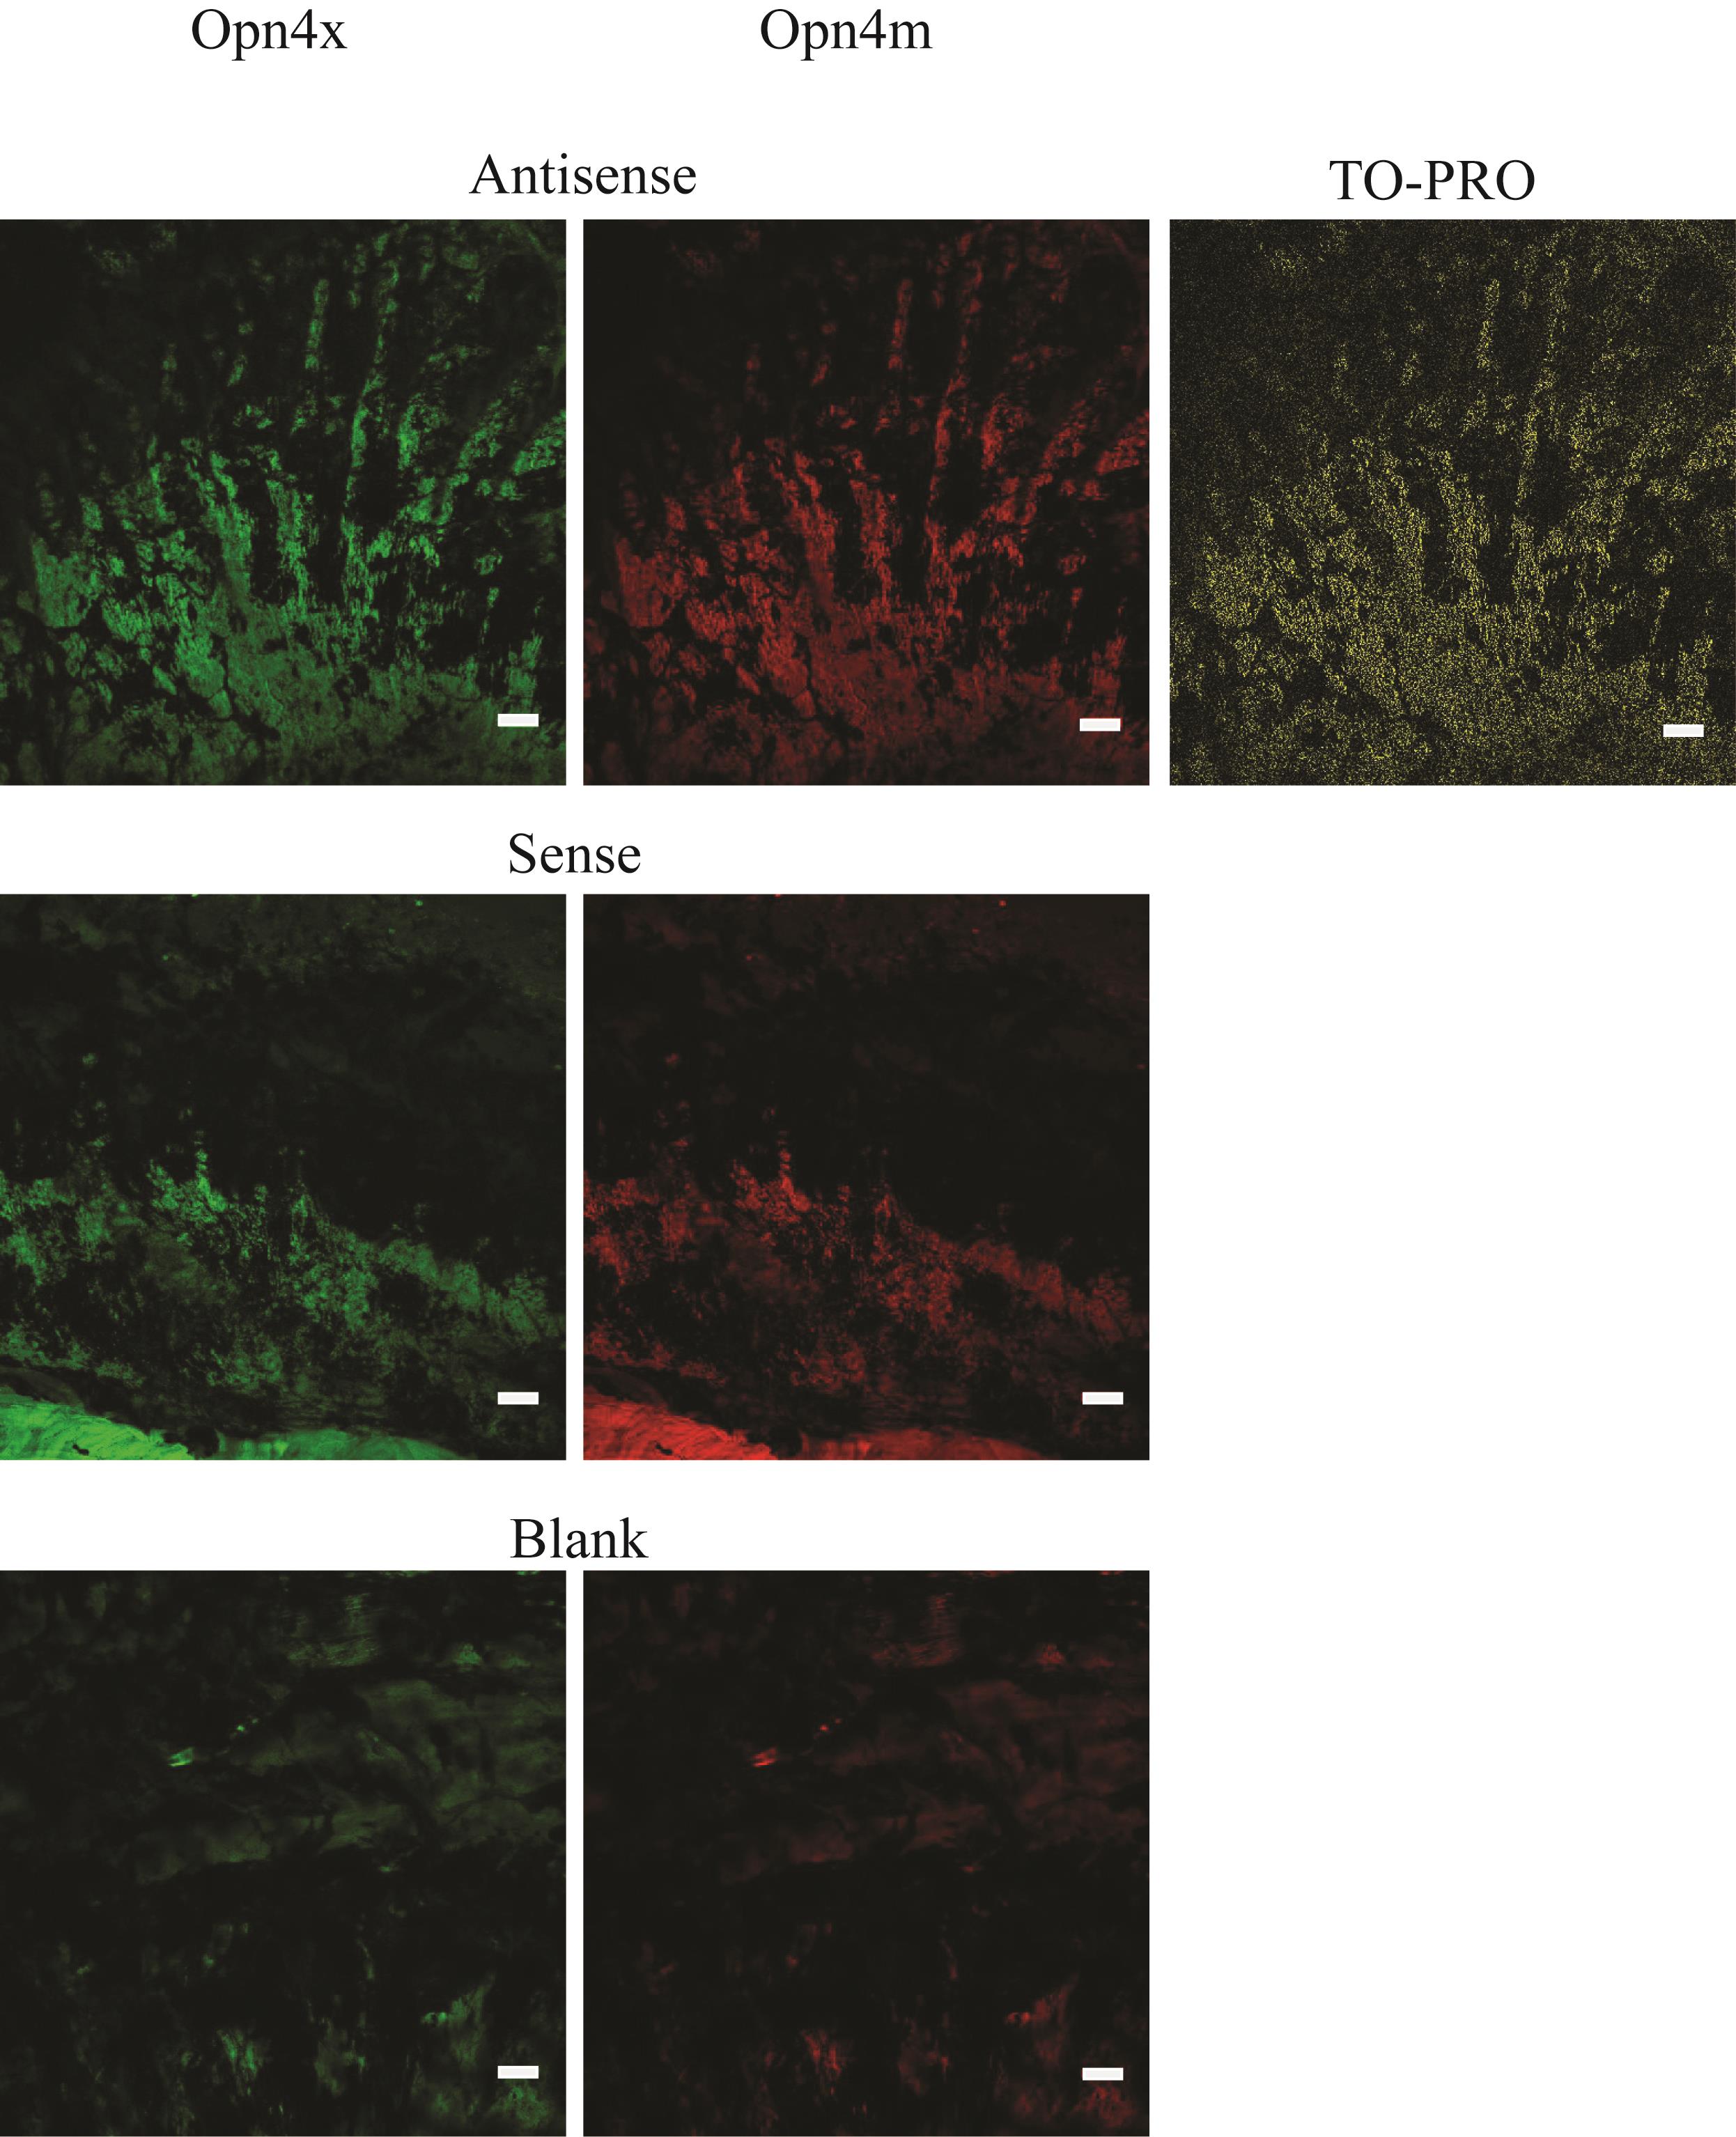
Figure 3: Fluorescence image yielded after non-specific binding and tissue auto-fluorescence was accounted for in the sense and antisense probes
- Fluorescence intensities were quantified from the antisense, sense, and blank slides
- The fluorescence of the blanks, antisense slides, and sense slides were determined from images of dorsal, ventral, temporal, and nasal regions from two different sets of irises
- There was a clear difference between the fluorescence intensity of the non-mammalian (Opn4x) and mammalian (Opn4m) antisense slides, (P<0.05; P<0.01 respectively)
- No significant difference was found between Opn4x and Opn4m sense treatments or blank controls was observed, (P=0.29; P=0.83 respectively)
- The fluorescence patterns were also found to be consistent in all four areas of the eye that were examined: dorsal, ventral, temporal, and nasal
- A one way ANOVA also showed significant difference for the fluorescence yielded by the sense and antisense probes, (P<0.003)