Animals
- Crayfish 8.9cm or greater were ordered from Carolina Biological Supply Company
- They were comprised of a mixture of Procambarus clarkii and Orconectes immunis
- (The species available depended on when the crayfish were ordered)
- They were comprised of a mixture of Procambarus clarkii and Orconectes immunis
- Crayfish were kept in separate containers with 3cm of dechlorinated water
- The water was changed every week
- Crayfish were exposed to a 12:12 hr light/dark cycle and were fed fish food 2x a week
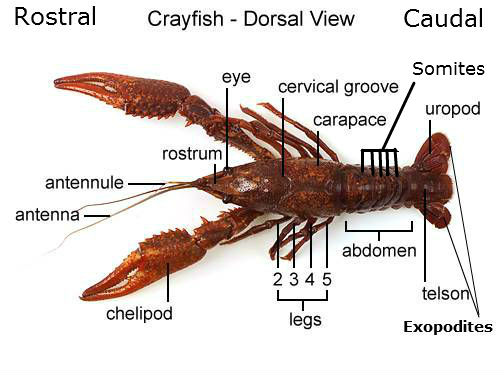
Dorsal View of Crayfish (https://sites.google.com/site/mrscastellucci/marine-science/crayfish-virtual-dissection/crayfish-dissection-1)
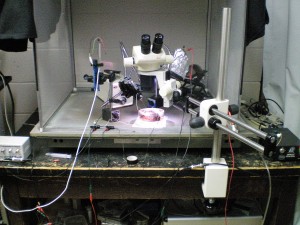
Recording Setup: Amplifier & Data Acquisition
- Extracellular recordings were conducted inside a Faraday cage
- The cage was made from aluminum screens (65x80x80cm)
- The cage was placed on top of 6 tennis balls to dampen vibrations
- When amplifiers are used to increase the intensity of the signals being recorded, irrelevant signals are also amplified in the process
- Faraday’s Cage is able to cancel some of the irrelevant signals, thus permitting the signal of interest to be communicated more clearly
- When amplifiers are used to increase the intensity of the signals being recorded, irrelevant signals are also amplified in the process
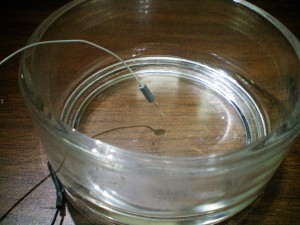
- A tungsten microelectrode was used to record natural responses
- The microelectrode was connected to a P55 A.C. Pre-Amplifier
- The purpose of the pre-amplifier was to send output to an AD Instruments Power Lab 26T data acquisition system
Ground Electrode
- The data acquisition system was connected with a computer, running the program LabChart
- The purpose of the pre-amplifier was to send output to an AD Instruments Power Lab 26T data acquisition system
- In order to isolate neural spikes, the P55 amplifier was set to 1000x, with a low filter cutoff set to 10Hz and a high cutoff to 3Hz
- These were the parameters the Faraday’s box was set to, in order to cancel out irrelevant signals, without affecting the signals corresponding to the neural spikes
- A RadioShack mini speaker/amplifier also received output from the amplifier, so the recordings could be monitored audibly

Light Stimulus
- A white LED, (light emitting diode, bulb was used to produce light responses
- The LED bulb was placed 23cm from the preparations
- The timing of the light exposure was controlled by using a Uniblitz® Electronic Shutter
- Whether the shutter was opened or closed could be determined by the TLL (transistor-transistor logic) signal that the shutter sent to the Power Lab
- 5V signal=closed
- 0V signal=open
- Whether the shutter was opened or closed could be determined by the TLL (transistor-transistor logic) signal that the shutter sent to the Power Lab
Dissection & Microelectrode Placements
- Crayfish saline was made in order to irrigate the tissues during the dissections
- The crayfish saline was chilled at 4°C and then bubbled with a mixture of 95% O2 and 5% CO2, in order to prolong the survival of the tissues (Aréchiga and Rodríguez-Sosa, 1998)
- By bubbling the saline solution with O2 and CO2, the solution was essentially infused with O2 and CO2
- Crayfish were anesthetized in ice for 1 hr before dissections (Gruhn and Rathmayer, 2002; Wyttenbach, Johnson, and Hoy, 2014)
- This was performed in an opaque bucket, to minimize the activation of light responsive cells by the ambient light
- The abdomen was then separated from the thorax
- The crayfish was cut at the rostral end of the 1st abdominal somite, using dissection scissors
- The abdomen was used to dissect the optic nerve fibers; the thorax was used to dissect the caudal photoreceptors
- The abdomen and thorax were kept in ice throughout the dissections, in order to maintain analgesia and minimize movements
- This step was completed in order to prevent the crayfish from feeling any significant pain during the procedure. The dissection was performed in a manner that was as humane as possible
- The abdomen and thorax were kept in ice throughout the dissections, in order to maintain analgesia and minimize movements
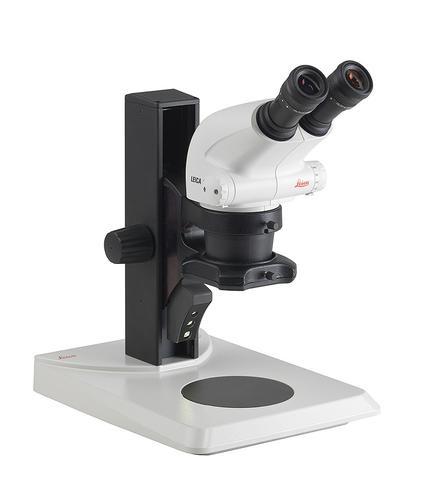
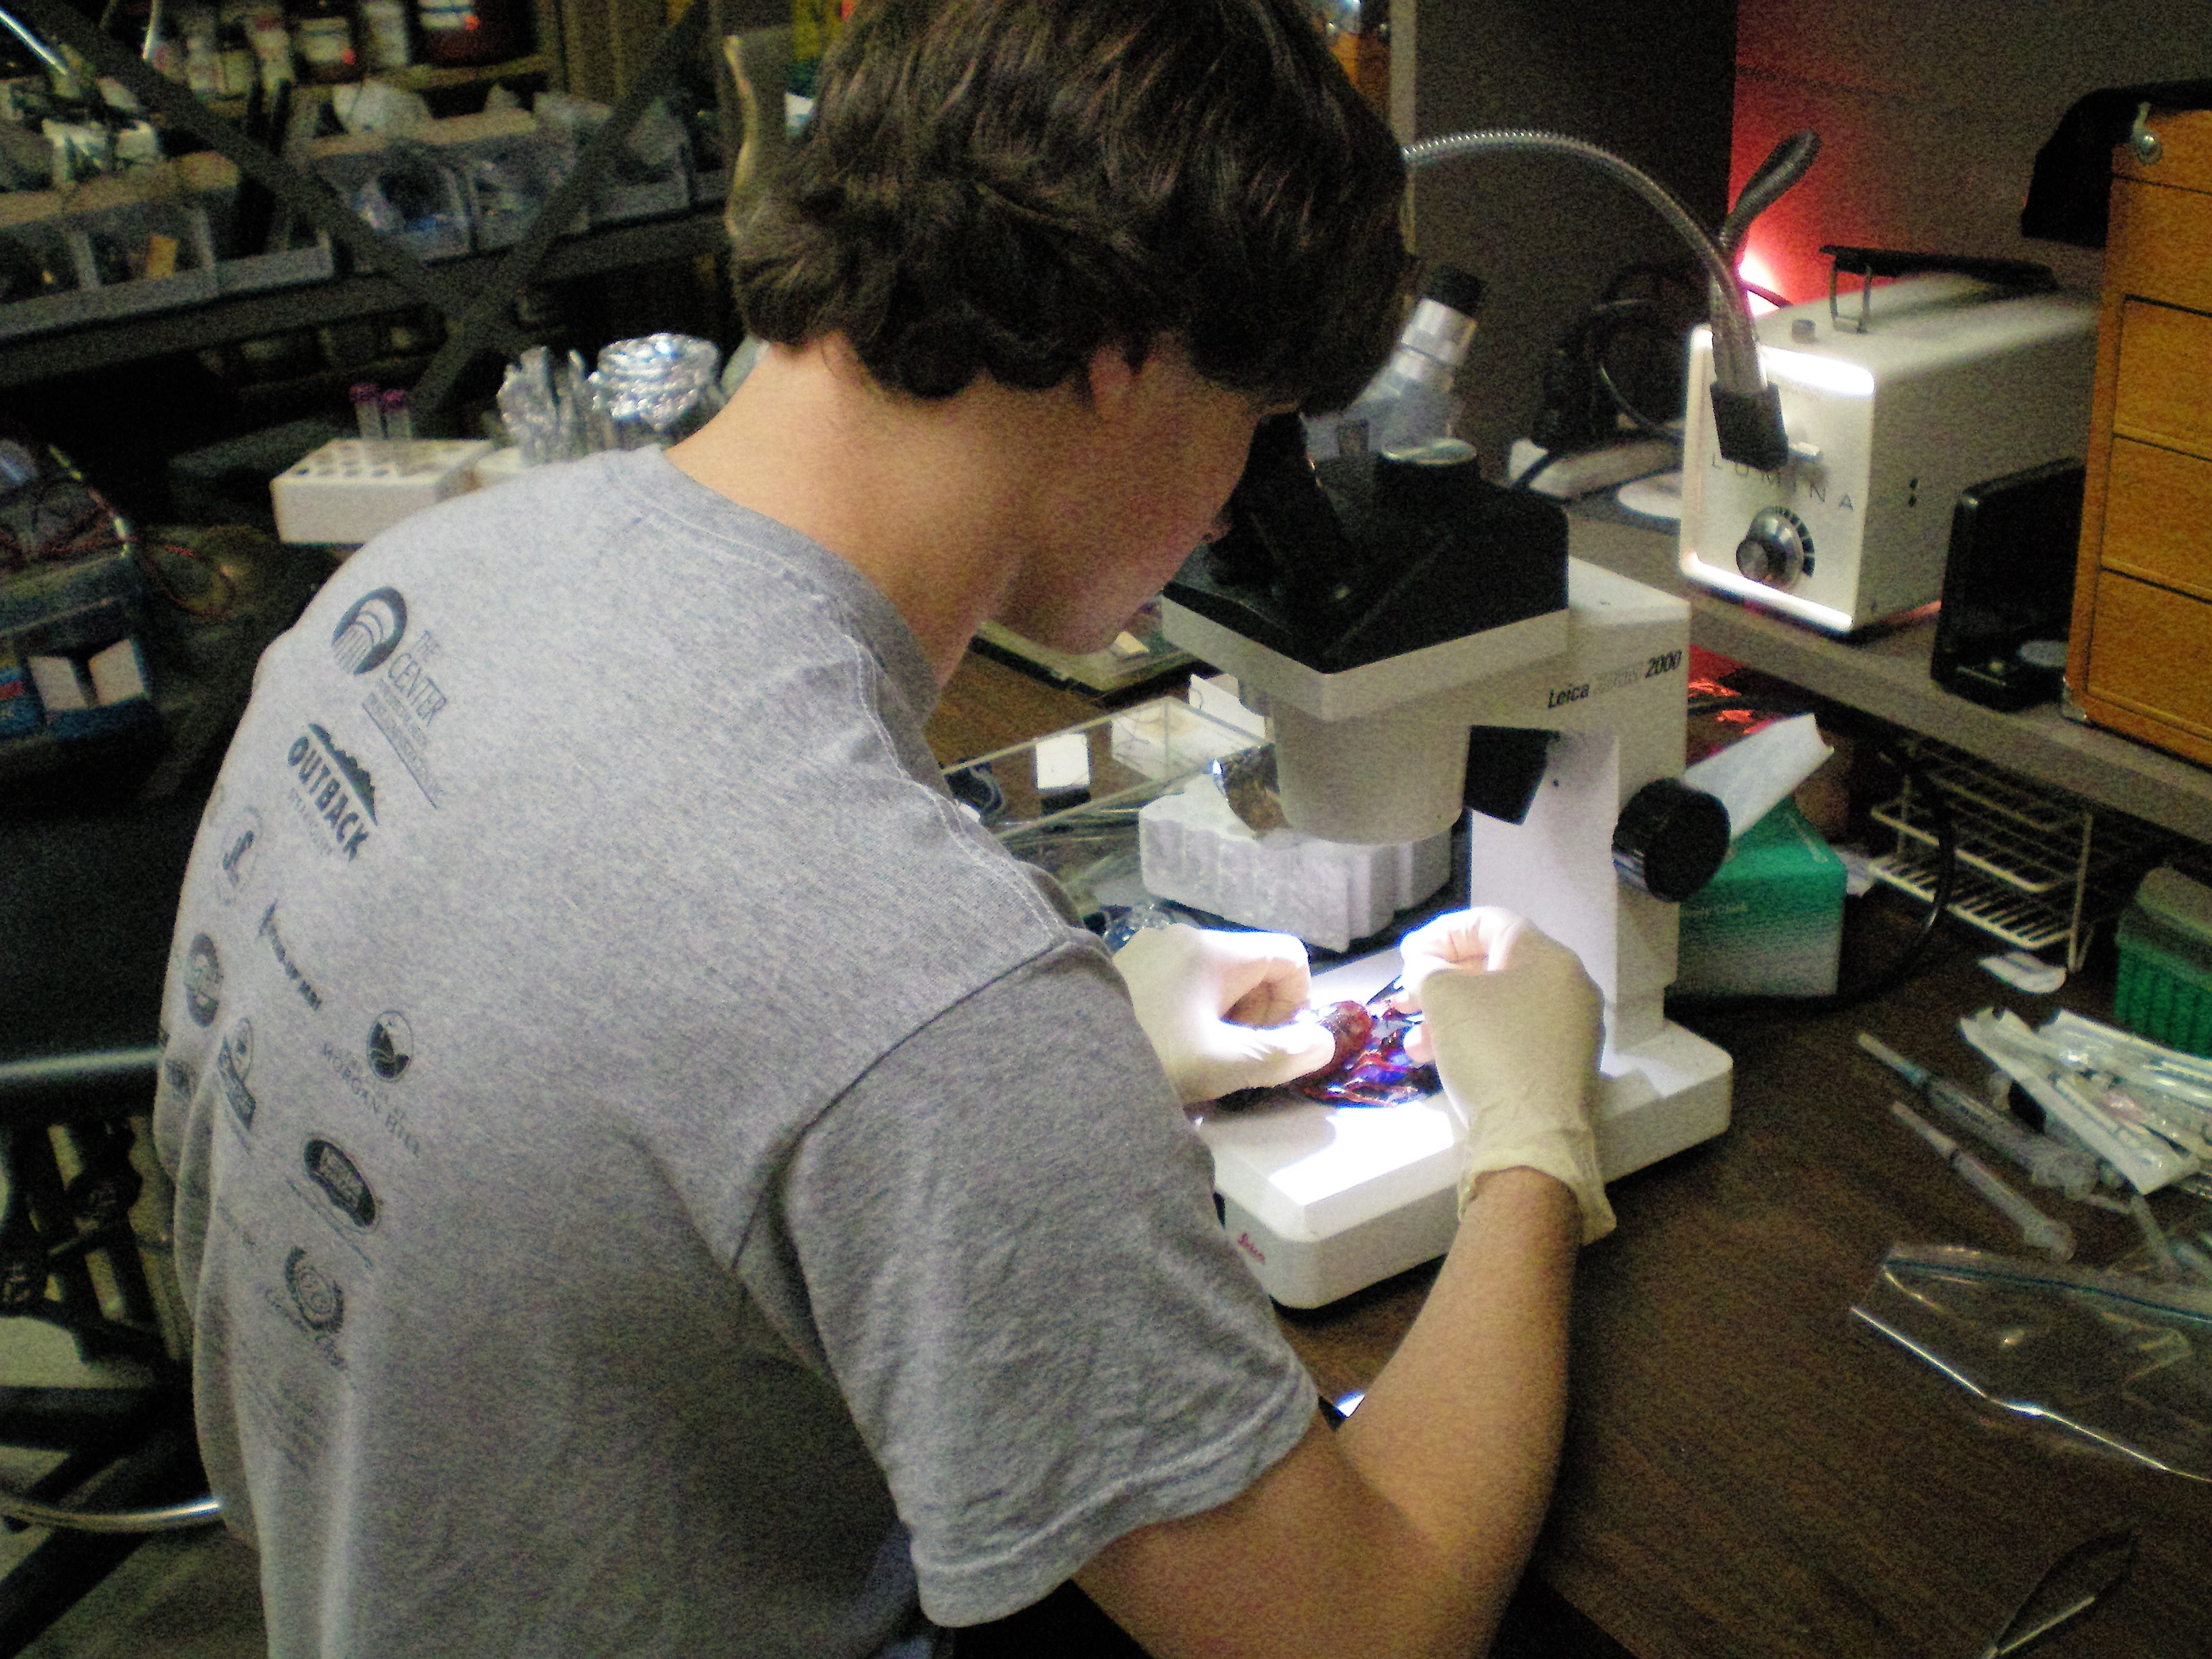
- A Leica Zoom 2000TM stereoscope was used to visualize the dissections
- Appropriate lighting was provided
Leica Zoom 2000TM Stereoscope (http://www.leica-microsystems.com/typo3temp/_processed_/csm_Leica_LED2000_0042_750px_fccc23ad43.jpg)
- A filter that attenuated to red light was applied to the optic nerve fibers, and a filter that attenuated to blue light was applied to the caudal photoreceptor, during the dissections
- The optic nerve fibers are most sensitive to red light and the caudal photoreceptor is most sensitive to blue light (Uttal and Kasprzak, 1962)
- By applying the red and blue light to the neurons, during dissections, the tissues are prevented from being stimulated by any light source
- If the optic nerve fiber and caudal photoreceptor are stimulated by light during the dissections then, bleaching could occur within the neuron
- This bleaching would lead to unsuccessful recordings of the neurons’ light responses (Kennedy and Bruno, 1961)
- A filter that attenuated to red light was applied to the optic nerve fibers, and a filter that attenuated to blue light was applied to the caudal photoreceptor, during the dissections

Optic Nerve Fibers
- Recording of the optic nerve fiber dissection occurred first, in the thorax of the crayfish
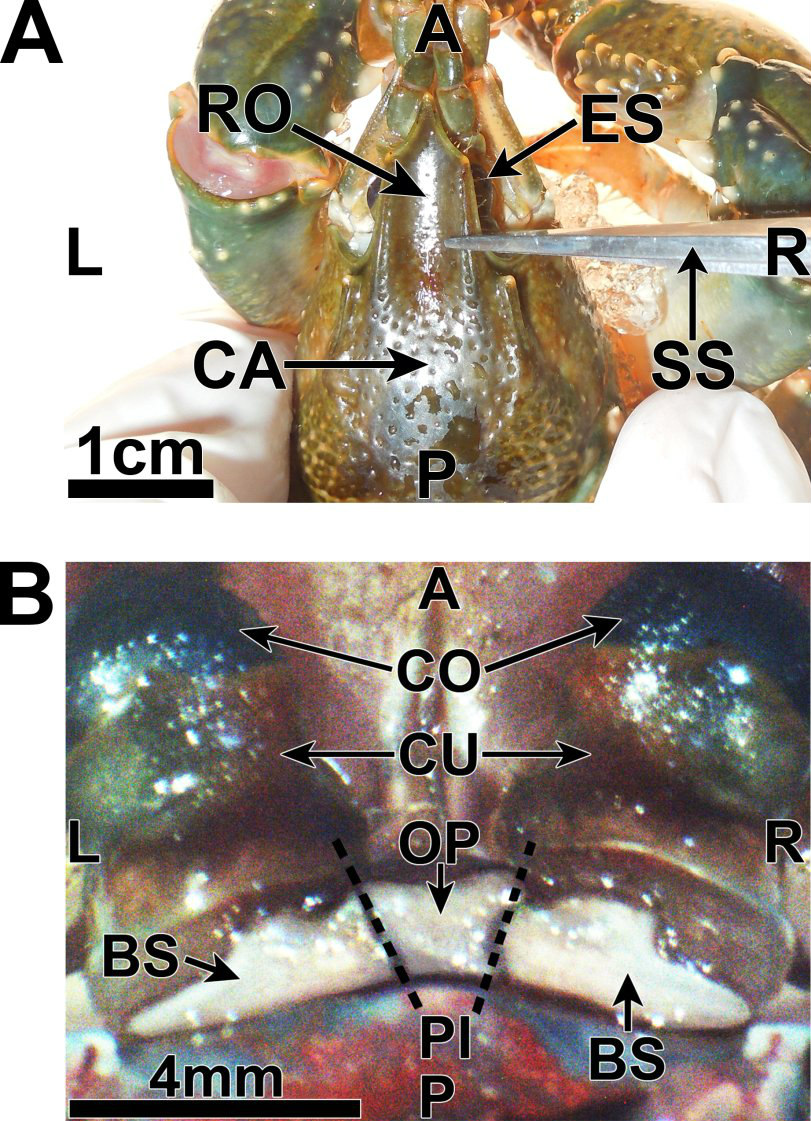
- Small dissection scissors were used to make a lateral transverse cut of the rostrum, just posterior to the eyestalk (Fig 3A)

Figure 3: A=anterior; P=posterior; L=left; R=right; ES=eyestalk; CA=carapace; RO=rostrum; SS=dissection scissors; CO=cornea; CU=cuticle of eye; OP=ocular plate; BS=basal sclerite; PI=potential incisions (two dotted lines) (Journal of Undergraduate Neuroscience Education)
- The scissors were kept at a shallow depth, during the cut, in order to avoid damaging the eyestalk
- A fracture located between the rostrum and the rest of the carapace was then produced by a small lateral cut
- Subsequently, the rostrum was removed by pulling the anterior end upward, in order to expose the eyestalks (Fig 3B; Video 1.3)
- Any remaining carapace, covering the eyestalk was then removed, using forceps and microscissors
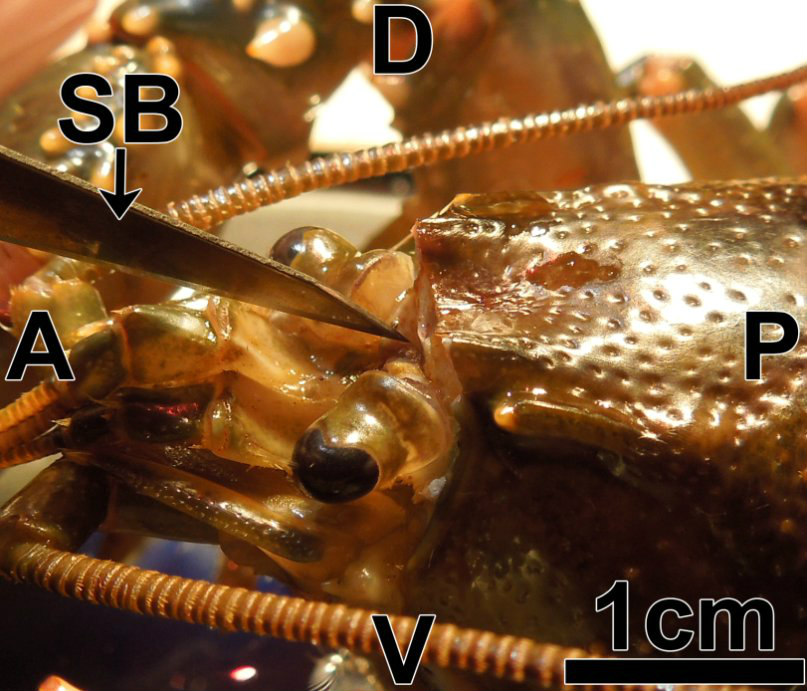
- A surgical blade was used to sever one of the two joints connecting the ocular plate of the protocephalon with the basal sclerites of the eyestalk (Fig 4; Video 1.4)
- This was done with the aid of a stereoscope
- A pin reference electrode was inserted into the flexor muscle of the abdomen at the exposed caudal end of the thorax, (where the abdomen was removed)
- The crayfish was then placed in the dissecting dish, submerged in ice
- The dorsal surface of the eyestalk was left exposed, so it could be exposed to the light stimulus
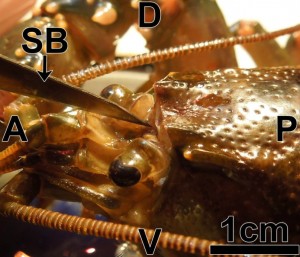
Figure 4: A=anterior; P=posterior; D=dorsal; V=ventral; SB=surgical blade (Journal of Undergraduate Neuroscience Education)
- The dorsal surface of the eyestalk was left exposed, so it could be exposed to the light stimulus
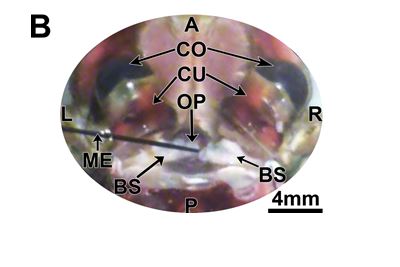
- A tungsten electrode was then inserted through the incision that separated the ocular plate of the protocephalon and the basal sclerite of the eyestalk
- The electrode was then placed carefully into the dorsal anterior region of the optic nerve (Fig 5B; Video 1.7)
- This insertion was performed with the help of a Leica GZ6 boom stereoscope
- Noticeable responses to light confirmed the proper placement of the electrode
- Once the electrode detected responses that were both strong and consistent, the preparation was dark adapted for 20min, in order to provide
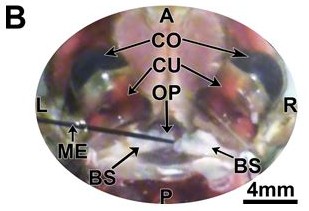
Figure 5B: A=anterior; P= posterior; L=left; R=right; GE=ground electrode; CO=cornea; CU=cuticle of eye; OP=ocular plate; BS=basal sclerite; ME=microelectrode (Journal of Undergraduate Neuroscience Education)
a baseline of measurements
- Once the electrode detected responses that were both strong and consistent, the preparation was dark adapted for 20min, in order to provide
- Responses produced by repeated presentations of the LED bulb were then recorded
- Light was shuttered in several second intervals that were followed by periods of dark conditions that were equal or greater in duration
Caudal Photoreceptor
- The dissection took place in the abdomen of the crayfish (cf. Wyttenbach, Johnson, and Hoy, 2014)
- The abdomen was pinned to the mounting material, located at the bottom of the dissecting dish, ventral side up
- 4 pins were used to secure the tail to the dish
- 2 were used to puncture the anterior end of the tergum
- There was 1 pin at each lateral edge
- The other 2 pins were punctured through each of the exopodites (see crayfish diagram)
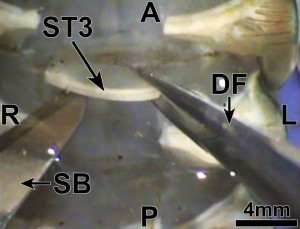
Figure 9: A=anterior; P=posterior; L=left; R=right; ST3=third abdominal sternite; DF=forceps; SB=surgical blade (Journal of Undergraduate Neuroscience Education)
- 2 were used to puncture the anterior end of the tergum
- The abdomen was then fully submerged in crayfish saline
- The swimmerets were left exposed
- The 95% O2 and 5% CO2 mixture was bubbled directly into the crayfish saline, throughout the dissection, to help preserve the tissues
- Each swimmeret was then removed from the abdomen
- The sternite was then dissected, in order to expose part of the ventral nerve cord
- A superficial transverse incision was then made in the integument at either the anterior or posterior edge of a sternite that was anterior to the 5th abdominal sternite
- The sternite was then cut at the lateral edges of the incision with microscissors
- The microscissors were positioned at a shallow angle and kept parallel to the medial saggital plane
- This was done in order to ensure that the scissors avoided contact with the ventral nerve cord
- The microscissors were positioned at a shallow angle and kept parallel to the medial saggital plane
- Using forceps, (Fig 9, Video 2.5), the medial section of the sternite was pulled away
- Any connective tissue that was still anchoring the integument to the ventral nerve cord was cut with a surgical blade

- Any connective tissue that was still anchoring the integument to the ventral nerve cord was cut with a surgical blade
- Shallow coronal cuts were made to help fold back the integument
- If the integument did not fold back, it was removed using microscissors
- The least number of cuts possible was desired during the dissection, in order to better preserve the tissues
- If the integument did not fold back, it was removed using microscissors
- A reference electrode was pinned to the mounting material located at the bottom of the dissection dish (Video 2.6)
- Then a tungsten microelectrode tip was inserted into the ventral nerve cord, anterior to the 6th abdominal ganglion (Kondah and Hisada)
- This permitted the recording of the action potentials moving from the axon of the caudal photoreceptor
- Once recordings were both strong and consistent, the preparation was dark adapted for 20 min.
- Then a tungsten microelectrode tip was inserted into the ventral nerve cord, anterior to the 6th abdominal ganglion (Kondah and Hisada)
- Responses to the LED bulb were then recorded for several seconds at a time
- Each exposure to light was separated by dark conditions of equal or greater extent

Analysis by Lab Chart
- Raw data was transferred from LabChart to MATLAB in order to identify spikes in current
- The dark condition firing rates corresponded to the frequency measurements that were recorded before the shutter switch opened
- The light condition firing rates corresponded to the frequency measurements that were recorded after the shutter switch opened
- Means and statistical analysis of the firing rates were then analyzed, using the program SPSS
- Paired t-tests were computed, in order to compare the mean firing rates of light and dark conditions of both the optic nerve fibers and the caudal photoreceptor
- Significant differences were determined by P values less than 0.05.
- Bar plots were then created using Excel