The End of Europe’s Dominance?
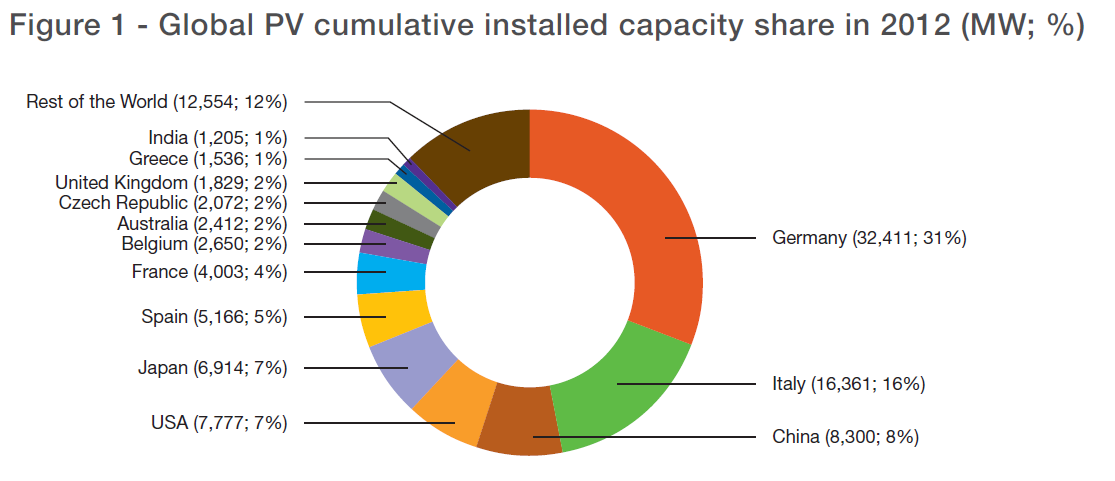
When you look at the each global region’s PV market share from previous years, one thing should stand out immediately – Europe has arguably dominated the global PV market for the past decade. In fact, Germany alone accounted for nearly one-third of the world’s total PV installed capacities, and Italy’s 16% share of the global PV market put the two countries controlling half of this market. Figure 1 shows PV installed market shares for the top countries in the market.[1] As you can see, when we look at this data at just a single point in time – in this case, 2012 – it looks as though Europe has a pretty strong grip on the market as a whole.
However, when we look at these market share numbers over the last decade, what we see is a slow but sure shift in the market share as the years go by. At this point, the statistics (which we will get to in a second) show that the PV market is becoming truly global. The most telling numbers are Europe’s declining market share from 2011 to 2012. In 2011, Europe accounted for a whopping 74% of the world’s new PV installations. In 2012, though, this share shrank to 55%. Yes, Europe is still controlling the majority of the global PV market, but these numbers combined with other global trends clearly show that the rest of the world is rapidly catching up to the continental PV juggernaut. Moving forward, the driving forces to expand the global market will not come from European countries, but rather, countries like China, USA, Japan and India. Figure 2 displays each major global region’s market share in both installation and production from 2000-2012.[1]
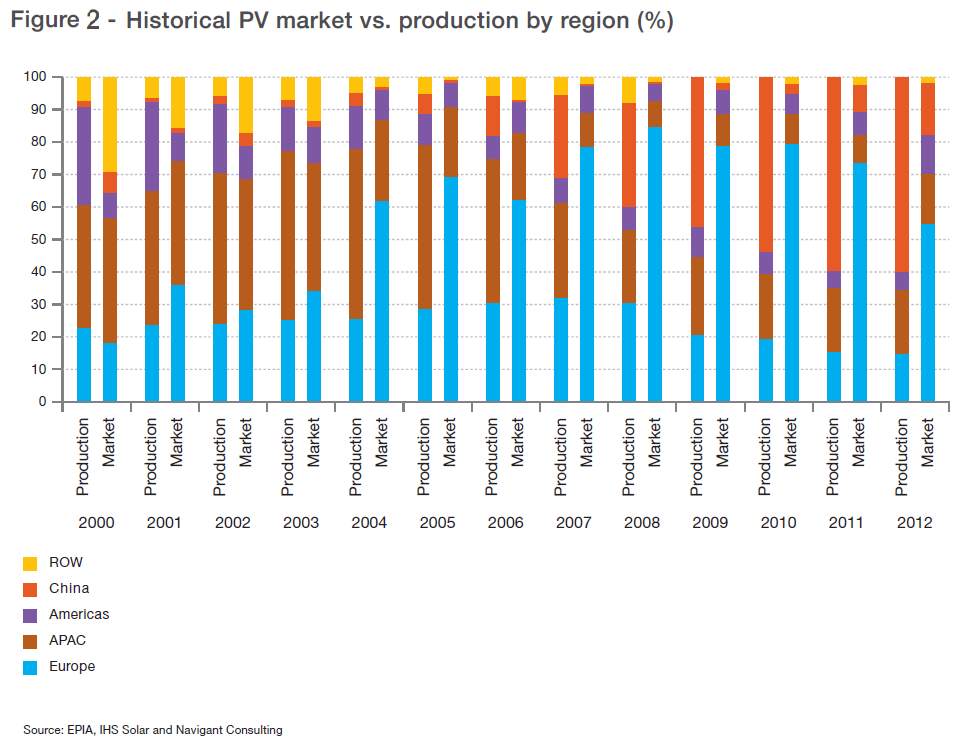
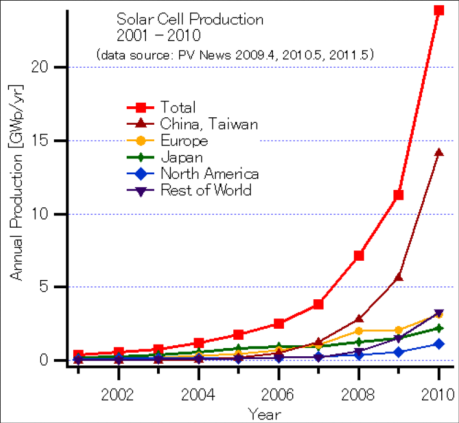
A few key things to note here – Europe’s declining market share in installations since 2008 (the light blue bar), and China’s booming increase in both production since 2005 and installation since 2008 (the red bars). An interesting fact is that based on this data, China is the only country in the world that can cover its growing PV market with its own PV production, having a whopping 320% more production than is needed – though this surplus should go down in the future due to local absorption of PV production. This domination in the PV production market is further displayed from Figure 3 below. Though the graph does not continue past the year 2010, the data from Figure 2 confirms that these trends have been relatively stable.[2]
Sunbelt Countries – Overwhelming Potential
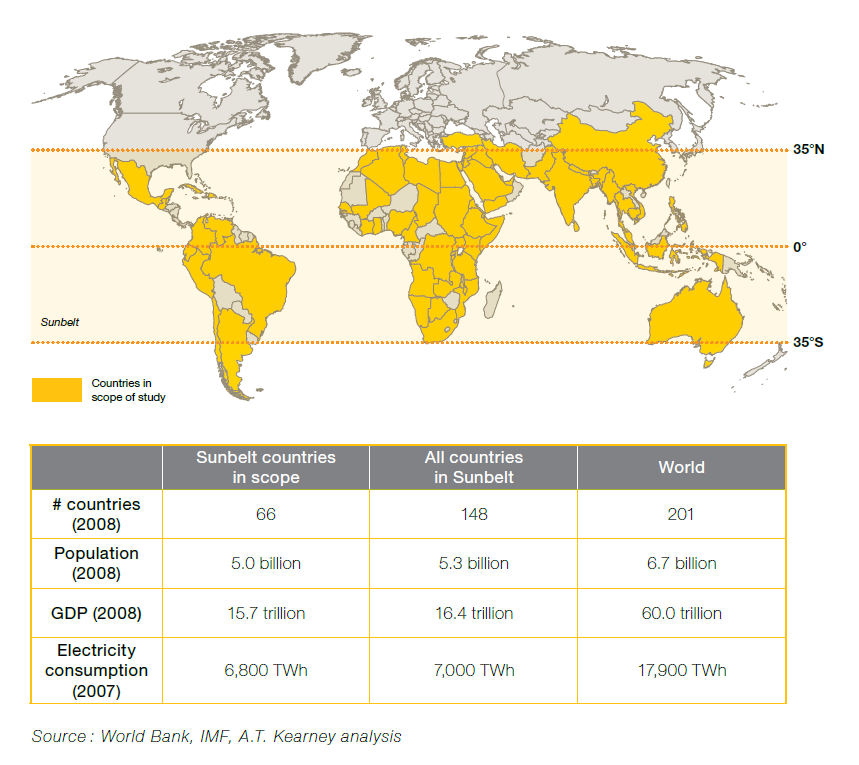
It’s easy to see that China really is leading by example for other non-European countries on the increasing reliability of solar PV energy. USA and Japan are not far behind, as they had a greater market share than China for several years until this growth of PV installed capacities boomed in China over the last five years. But after these big three pioneers, what countries have the most potential to expand their PV markets? The secret may be to take advantage of the enormous potential for PV market expansion in the “Sunbelt” countries. These Sunbelt countries are the major countries primarily located within 35 degrees-longitude of the equator, giving these areas optimal exposure to sunlight, and therefore, maximum potential for solar PV applications. Figure 4 below shows that only 66 of the 148 countries in the Sunbelt are within the scope of EPIA’s study; however, these 66 countries represent 97% of electricity demand for all countries located in the sunbelt (and 38% in the world), and 95% of the population within the Sunbelt (and 75% in the world).[3]
The following map (Figure 5) is a PV “Opportunity” Map that estimates the overall “attractiveness” to increase PV installation capacities in the given countries based on a number of factors.[3]
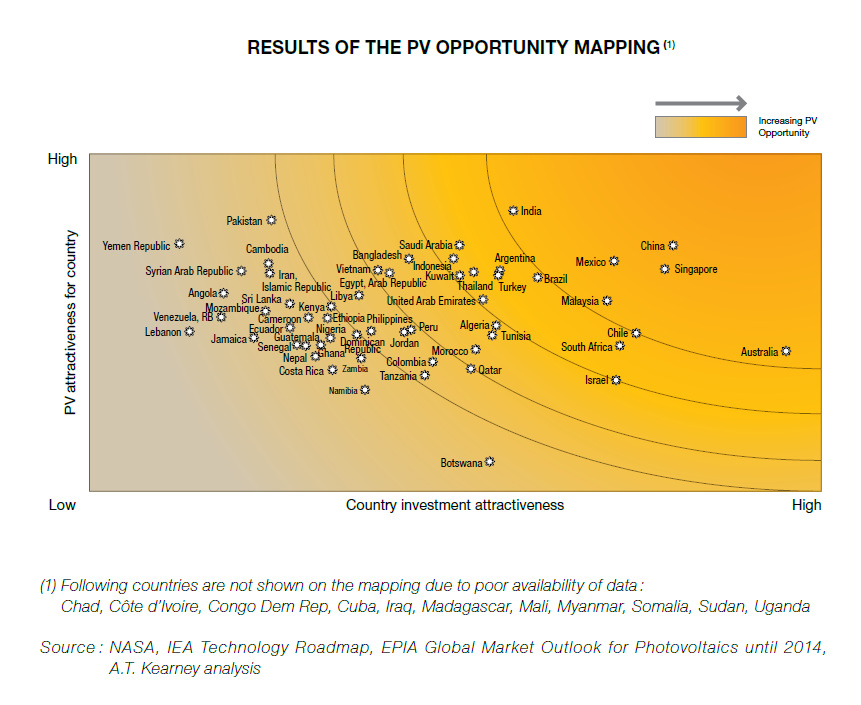
The curved lines going across the map represent “tiers”; for example, China, Singapore, Mexico, Australia, and India are the most attractive countries to grow PV installation capacities, whereas second-tier countries such as Argentina and South Africa have a little less potential and a little more risk. This “attractiveness” takes specific criteria into account, including overall market potential, financial stability, renewable energy policies, size of electricity market, projected electricity consumption growth, etc.
Depending on the development scenario, PV potential in Sunbelt countries could represent 27% to 58% of the forecasted global PV installed capacity by 2030. Considering that, as of 2009, these Sunbelt countries only made up 9% of the PV market, there is an unprecedented amount of potential in these developing markets over the next 10 to 20 years. The expansion of PV markets in these Sunbelt countries could be the “x-factor” that make solar PV energy the #1 renewable energy source in the future.
For more information, view: [1] [2] [3]
Primary Author – Joe Donatoni
Primary Editor – Benjamin DeForest
I think this is among the most important information for me.
And i’m glad reading your article. But wanna remark on some general things,
The site style is ideal, the articles is really nice :
D. Good job, cheers
Hurrah, that’s what I was searching for, what a material!
present here at this weblog, thanks admin of this site.
My blog language translation tool – http://www.sopothotel.pl,
What’s up to every body, it’s my first visit of this
web site; this web site includes awesome and truly good stuff in support of visitors.
I’m gone to tell my little brother, that he should also
pay a quick visit this weblog on regular basis to obtain updated from
most up-to-date reports.
You really make it seem so easy together with your presentation however I in finding this matter to
be actually something which I believe I would by no
means understand. It seems too complex and very large for me.
I am having a look ahead on your next publish, I’ll try to
get the dangle of it!
What do you think of the feasibility of hydrogen fuel cells for a commercial solar array away from major power grids? For example, a floating raft of solar panels offshore, perhaps with a hydrogen-powered barge to bring the hydrogen to shore, where it’s either sold as transportation fuel or converted to electricity and fed into the grid.