LET’S TAKE STOCK!
It is crucially important to identify how solar PV companies have been doing in the market because a majority of them are dependent on equity financing. Strong results in the stock market lead to increased confidence among investors and subsequently more funds for this relatively nascent industry to grow. So how has solar PV been behaving in the stock market? Very well according to the data!
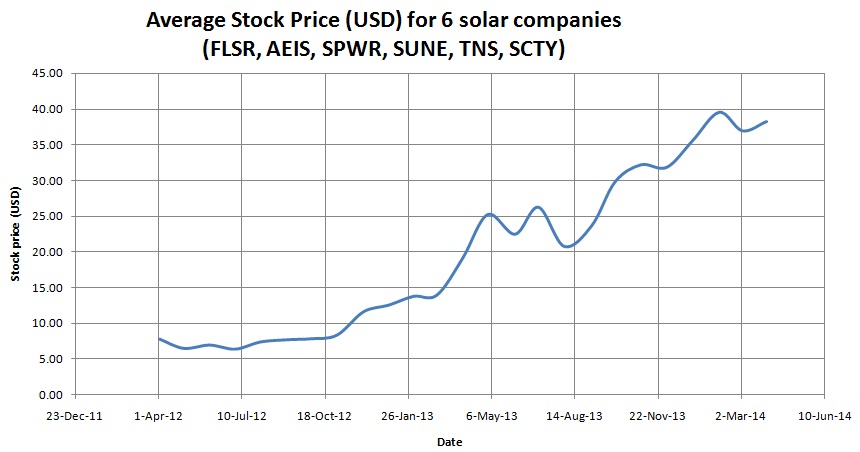
To analyze the stock prices of solar companies in the U.S., 6 U.S. solar energy companies were selected: First Solar, Advanced Energy Industries, Inc., SunPower, SunEdison, TrinaSolar and SolarCity. The companies were selected such that there was a mix of solar companies which had been exceeding expectations over the past 5 quarters (such as First Solar, etc) and those which were not doing as well as predicted (such as SunEdison). In this manner, a more meaningful industry trend could be obtained than if only the top few or bottom few companies were being analyzed. The stock prices from 2012 onwards were selected in order to minimize the aftereffects of the 2007 recession on the trends. As the figure shows below, a positive, upward trend is seen in the performance with the current average stock price value of 38.2 approximately 4.9 times the value in April, 2012.

PROFIT MATTERS
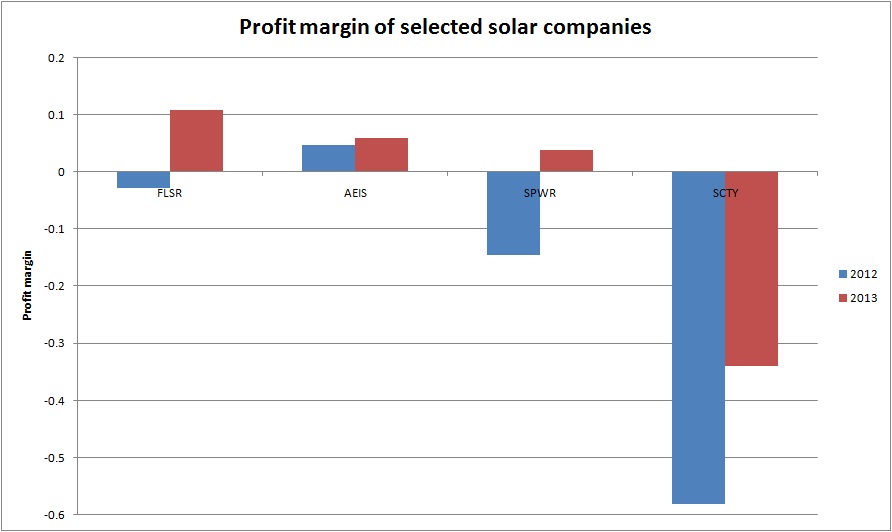
Along with stock market performance, the ‘profit margin’ of a company, defined as the ratio of net income to revenue, is an important parameter, analyzed by investors trying to determine how much of the revenue a company is actually being able to convert into profit (or loss).
A profit-margin bar graph was constructed for the 4 of the 6 companies analyzed and the resultant bar graph is shown below. The profit margin for all the companies shown in the figure display an improvement from the previous year. As the profit-margin of the company increases, it is able to pay higher rates of dividend, thus attracting more stock buyers which drive up the stock price.

Primary Author: Apratim Mukherjee
Primary Editor: Joe Donatoni