Environmental scholars and sustainable builders praise green roofs as a tool for mitigating the negative impacts of our built environment and resource exhaustion, as well as to create a sustainable urban infrastructure (Li, 2004). Green roofs help to do this by managing and retaining stormwater runoff, reducing the urban heat island effect, improving water and air quality and providing additional urban green spaces.
The aforementioned environmental issues are a result of centuries of decisions and actions made by individual citizens, stakeholders, and community leaders. Predominantly, they are rooted in two main events, the industrial revolution, and the resultant environmental movement. The industrial revolution increased anthropogenic emissions, urbanization, and many consequential environmental issues seen in urban areas. The environmental movement helped to create many of the solutions to environmental issues, such as green roofs.
Environmental Movement:
During the 18th and 19th century, the United States, and the world as a whole underwent significant economic, technological, cultural, and social changes known as the Industrial Revolution. The development of industrial processing and civic development increased greenhouse gas emission in our atmosphere (Zachos, Dickens, & Zeebe, 2008). Converting the earth’s emitted light into heat and re-emitting it as heat, greenhouse gas emissions have increasingly grown with technological advancements and increased production (Lashof & Ahuja, 1990). The global CO2 emissions over 264 years, broken by world region is shown below in Figure 2. Although not fully recognized until 1980, the impacts of greenhouse gas emissions and global warming negatively impact almost every ecosystem in the world (Hansen 1998). Beyond widespread global impacts, climate change impacts individual countries, states, and cities. The impacts of climate change affect communities and individuals of lower socioeconomic status more than affluent ones, a concept known as environmental injustice (Ikme, 2003). Starting in the 1960s and 1970s, research of greenhouse gas emissions on our current and future globe and their effects sparked the environmental movement (Dunlap, 2014).
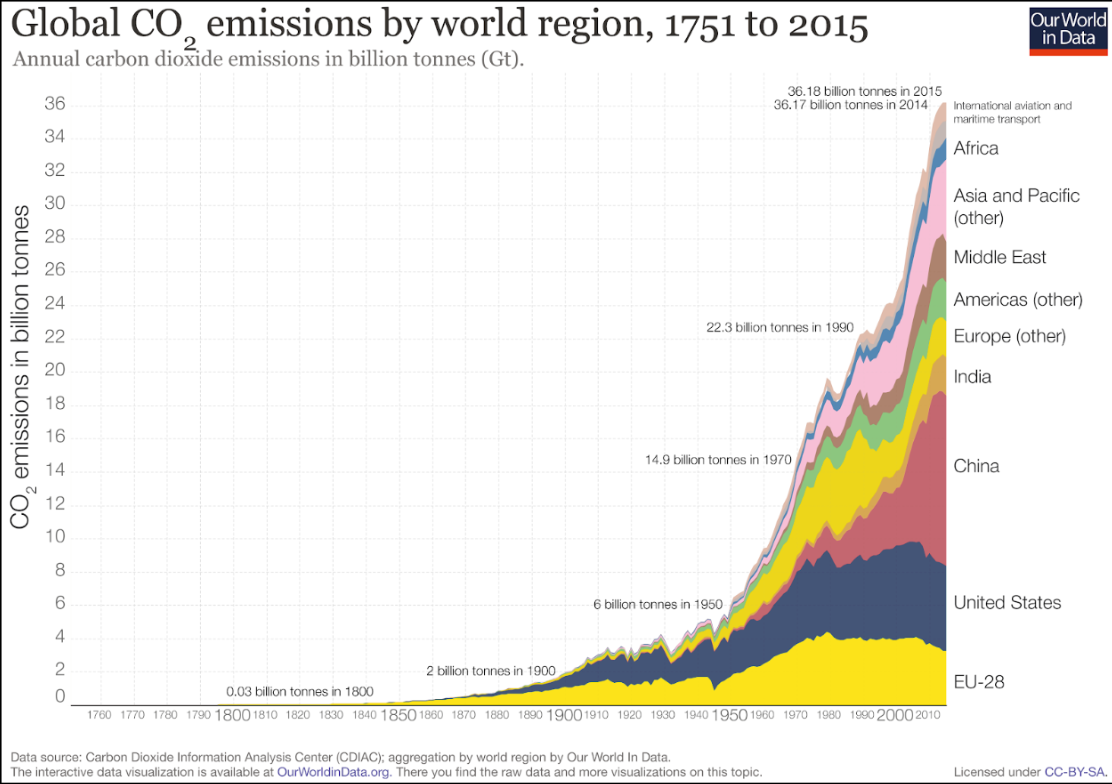
Figure 2. Global CO2 emissions over 264 years, broken by world region. Note the stark increase in Global CO2 emissions following the Industrial revolution (approx 1840), as well as the proportions of global emissions contributed by China, the United States, and the European Union. Adapted from The Carbon Dioxide Information Analysis Center, H. Ritchie and M. Roser, 2018.
Driven predominantly by research and political activism, the environmental movement has two main purposes. First, it works to mitigate existing negative consequences of human activity on earth. Second, it creates new solutions to replace existing ones which produce less environmental harm. Mitigations and solutions exist within each major sphere of our society: social, political, technical, and economic. Additionally, they span among multiple scales: from the individual, to corporate, to city-wide, to national, to global. Mindful development and effective implementation of mitigation and prevention strategies help to diminish the existing negative impacts of climate change, while specifically working to ensure those impacted most receive the most aid.
City/Civic Planning:
Impacts of climate change differ based on population distribution and land type, predominantly between urban and rural areas (International Panel on Climate Change, 2018, p. 109). A rural area is a geographic location which lies outside of towns and cities. Some of the predominant characteristics of rural areas are low population densities, small settlements, and agriculture as the main source of occupation (Mondal, 2014). On the other hand, an urban area is a geographical location such as a town or city. Characteristics of urban areas are high population densities, well-developed infrastructures, and a large built environment (rather than natural).
Many United States citizens who once lived in rural areas have now moved to cities (Urbanization in the United States, n.d.). With this shift comes many benefits, including a multitude of resources (schools, hospitals, grocery stores, etc.), job opportunities, access to public transportation, and community spaces. However, with these benefits come some significant downsides. The dense population in urban areas often leads to very high levels of pollution, including significant air and noise pollution from factories and vehicles. The many buildings, roads, and sidewalks have removed the natural landscape, such as grass and trees. Although it may not seem initially problematic, the growth of impervious surfaces leads to an increased risk of flooding. Easton is no exception to these issues.
Impervious Surfaces:
Out of the four neighborhoods in Easton (College Hill, West Ward, Downtown, South Side), approximately 40% of the urban environment is covered by pavement (Frankel & Goldman, 2017). In particular, 57% of the Downtown neighborhood is covered with pavement, making it particularly susceptible to the urban heat island effect and flooding (Frankel & Goldman, 2017) as visualized in Figure 3 and stated in Figure 4.
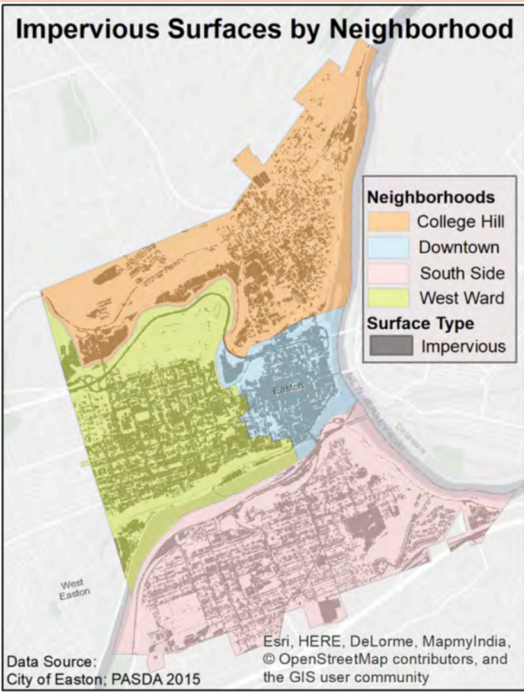
Figure 3. The proportion of land covered by impervious surfaces shown in gray, with neighborhoods of Easton distinguished by color. Adapted from The Vulnerability Assessment for the City of Easton, Nurture Nature Center for the City of Easton, 2018.
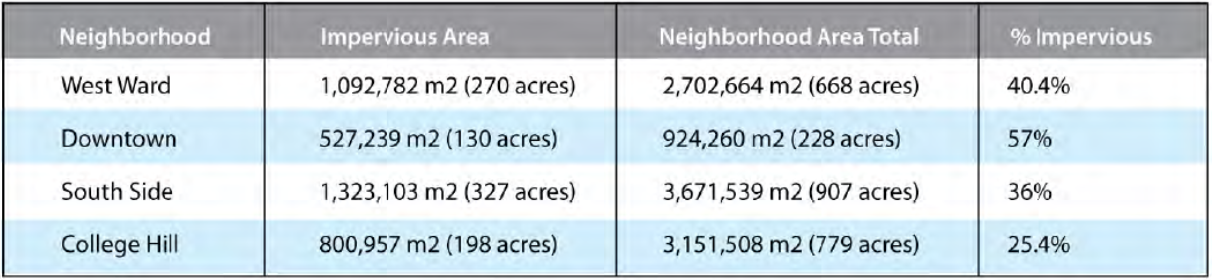
Figure 4. The total area of impervious surfaces in Easton neighborhoods. Adapted from Vulnerability Assessment for the City of Easton, Nurture Nature Center for the City of Easton, 2018.
The Urban Heat Island Effect:
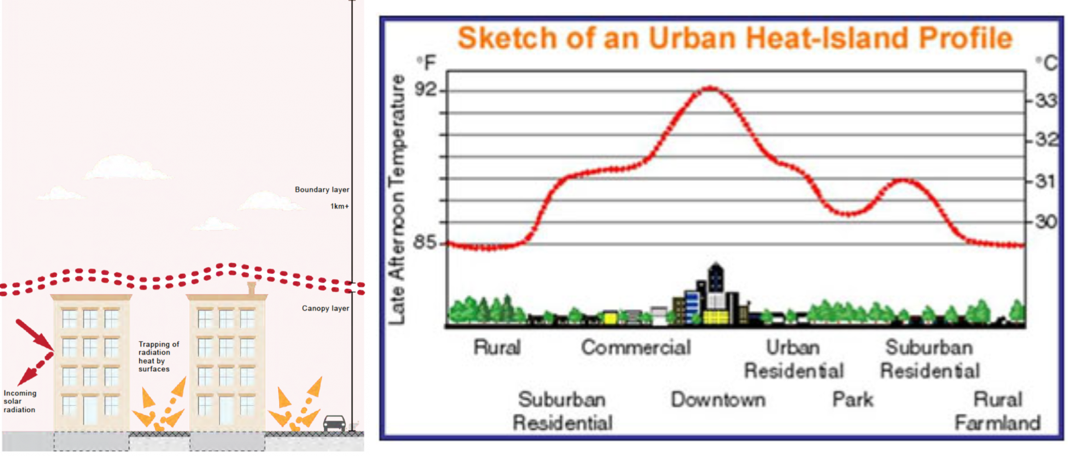
An urban heat island is an area that is significantly warmer than areas around it (especially during the summer), caused by modified land surfaces. There are two main causes of the urban heat island effect: surface properties and human activity. Approximately 60% of the surface area in cities are roofs and pavement. These surfaces are usually darker in color, and therefore not as absorbent to incoming heat (National Geographic, 2011). Previously present landscapes like grass, which removes heat from the surrounding air, is replaced with surfaces such as asphalt and concrete that do not absorb heat as effectively as natural surfaces (Oke, 1982). Rather than absorbing heat from the atmosphere, the surfaces re-emit heat energy back into the urban environment, increasing air temperature. This is demonstrated in Figure 5. Additionally, the human activities associated with urban environments, such as air conditioning, manufacturing, transportation, produce excess heat which is then emitted into the atmosphere. In conjunction, these two features contribute to heat production and a lack of heat absorption in urban areas, as seen in Figure 6 (Akbari, 2009).
The urban heat island effect impacts more than just temperature in urban areas. Increasing air temperature in cities leads to increased overall energy use (mainly through more air conditioning), impaired air quality (the formation of smog), and increased illness (through aggravating respiratory illness) (Urban Heat Islands, n.d.). Mitigation strategies of the urban heat island effect include increasing tree coverage and vegetative cover. (Heat Island Cooling Strategies, 2016).
Easton has experienced five heat waves between 1997 and 2014 as shown in Figure 7. The Vulnerability Assessment for Easton concludes that these heat waves are regularly occurring events, and are being worsened by sources of heat during daytime activity, and a lack of urban cooling at night. “The West Ward and Downtown are the most vulnerable to extreme heat events, as both areas have the most impervious surfaces as well as the least amount of green spaces and tree canopy coverage, resulting in higher energy usage” (Nurture Nature Center for the City of Easton, 2018).
Figures 5 and 6:
Figure 5. The sources and impacts of incoming solar radiation on heat in urban areas, known as the urban heat island effect. Adapted from Urban Heat Islands, by General Service Administration, 2011, General Services Administration.
Figure 6. A sketch of an urban heat-island profile. Adapted from The Energetic Basis of the Urban Heat Island, by T. R. Oke, 1982.
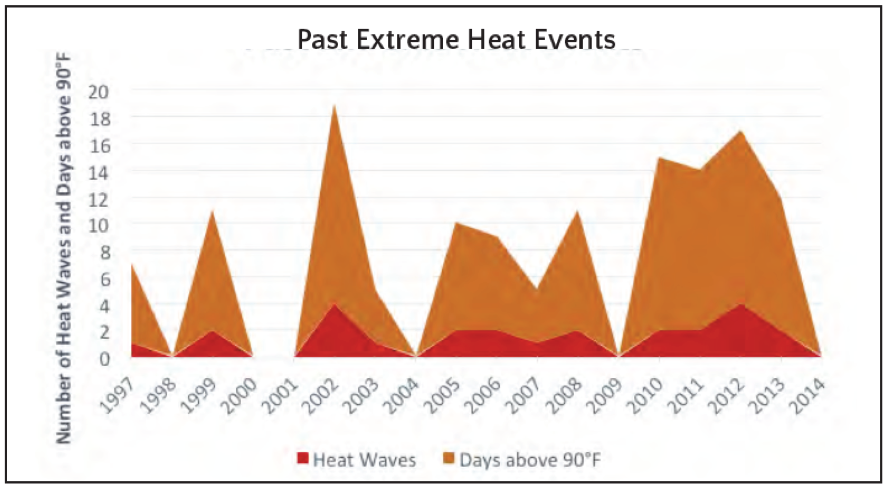
Figure 7. Extreme heat wave events in Easton, Pennsylvania from 1997 to 2014. Adapted from Vulnerability Assessment for the City of Easton, PA, by Nurture Nature Center for the City of Easton, 2018.
Flooding:
Large rain storms produce a great amount of water, which is usually absorbed and stored through natural surfaces. Once they are removed and replaced with impervious surfaces, such as roads, sidewalks, and buildings, the rain no longer gets absorbed. To compound the issue, urban areas typically do not have very good drainage systems. Therefore, urban areas are very prone to severe flooding. The increased risk of floods impacts those within the floodplain (usually closer to rivers and streams), more than those on higher ground.
Easton has a history of devastating floods. In the summer of 1955, Hurricanes Connie and Dianne passed through the Lehigh Valley. Easton had not received significant precipitation in the area before the storms, so was flooded extensively. The water claimed 70 lives and caused over $10 million worth of total damage, including the destruction of Northampton Street Bridge between Easton and Phillipsburg. In total, the flood of 1955 produced flood levels of 43.7 feet, which Easton residents describe as a “measuring stick” for future flooding and damage assessment (Frantz, 2015).
More recently, in 2004, Hurricane Ivan devastated a large portion of the northeastern United States. Similar to the flood in 1955, Hurricane Ivan caused a great deal of structural damage, largely due to the severe winds. However, rainfall led to the flooding of the Delaware River Basin, in which Easton lies. This flood produced 33.45 feet of water in Downtown Easton, which can be seen in Figure 8. Cleanup efforts and damage assessments followed shortly after, but without any significant changes. Easton has seen many floods in the years since, such as in 2005 and 2006 (Rhodin, 2011).
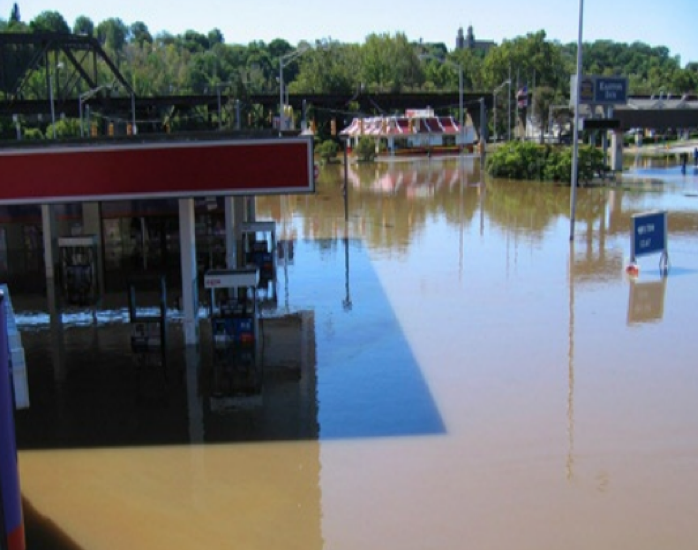
Figure 8 Impacts of the 2004 flood in Easton, Pennsylvania. Adapted from The Delaware River Floods of 2004, 2005, and 2006: Causes and Lessons Learned. In World Environmental and Water Resources Congress 2007: Restoring Our Natural Habitat, by D. Kucz, 2007.
Since the Delaware River runs through Easton, Downtown Easton lies within a floodplain. This puts many of the homes and lots of the city’s infrastructure at risk of flood damage. Impacts of flooding cannot be easily diminished through engineering solutions or managing infrastructure but can be mitigated through increasing natural landscapes and developing storm management tactics.
Air Pollution:
According to the American Lung Association, the Lehigh Valley in which Easton lies is the 14th most polluted region in terms of particle pollution in the entire United States, increasing from the previous year (Olanoff, 2013). Deteriorating air quality impacts both public health and the economy. Poor air quality contributes to increased occurrences of asthma, heat exhaustion, and worsening of chronic illness, as well as an increase in public and private spending related to health impacts. Vulnerable populations are most at risk of feeling both of these effects (Nurture Nature Center for the City of Easton, 2018).
Water Pollution:
Water quality degrades with increased impervious surfaces and prolonged heat events. Surface runoff from concrete accumulates pollutants present on surfaces of urban areas. A lack of vegetation inhibits the ability for natural water purification and allows water of lesser quality with potential pollutants to enter waterways (Tong 2002). The prolonged heat events in Easton degraded plant, mammal, and fish populations, and increased algae growth. Both have led to compromised water quality in the area (Frankel & Goldman, 2017).
Easton’s Concerns:
Environmental mitigation efforts are most effective when they are crafted with careful consideration for their recipients’ wants and needs. Within the realm of Easton, this means identifying which aspects of their environment they feel impacts them the most, supplemented with reputable data to ensure that the community’s needs overlap with sufficient supporting information. In order to make the most effective solutions for environmental issues identified by the city of Easton, we reviewed the data and perspectives compiled in the Easton Matters Report. The Easton Matters Report was produced in 2016 and organized by Easton’s Nurture Nature Center. The report includes responses of: 311 from the individuals from the four distinct neighborhoods in Easton (Downtown, South Side, West Ward, and College Hill), interviews of 16 city officials (representing the mayor, planning department, public works, city council, and city arborist), and 18 representatives of ten Community Based Organizations (CBO). While this sample size is fairly small, particularly for the city officials and CBO’s, the responses sufficiently encompass Easton’s main environmental concerns. The quantitative results of the survey are shown in Figure 9 and Figure 10 below.
Certain environmental concerns are far more important to residents of Easton than others. For Easton as a whole, the most important environmental concern is water quality, with about 23% of the respondents identifying it as a top concern. Air quality is second, with about 20% of the respondents identifying it as a top concern. Flooding, which has historically been a large issue in Easton and the entire Lehigh Valley, is the sixth greatest environmental concern, with about 12% of the respondents identifying it as an issue.
Each neighborhood identified different environmental issues as the most important to them. Downtown identifies food access as their largest environmental concern while the South Side identifies trash and litter as theirs. The West Ward identifies crime and drugs while College Hill identified water quality (Frankel & Goldman, 2017). All of this data is presented below in Figure 9.
Major environmental concerns identified by the 16 city officials differ from those identified by the residents. City officials, who pass legislation and have the potential to create large changes within Easton, believe that the two most important environmental concerns facing Easton are flooding and water quality. Other major environmental concerns they identify are stormwater runoff, access to food, and air quality. The 18 representatives of ten CBO’s identify trash as the greatest environmental concern (Frankel & Goldman, 2017). All of this can be seen below in Figure 10.
Several environmental concerns frequently surface as a top priority among residents of Easton, the public officials, and the CBO’s. Flooding, air quality, water quality, stormwater runoff, and food access are environmental concerns of all three groups. Because each of these issues has been previously identified as problems green roofs can solve, we believe that green roofs will help Easton meet its environmental goals and position itself for a sustainable future. Widespread and strategic implementation of environmental solutions in urban contexts is most effectively implemented with policy.
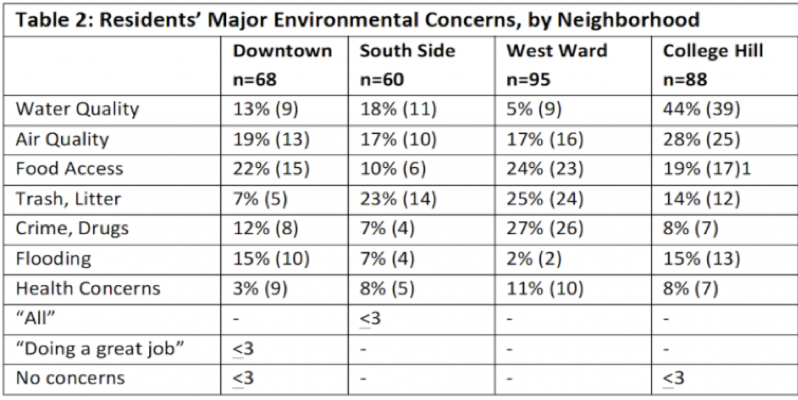
Figure 9. Individual Responses to the “Easton Matters” Report of major environmental concerns organized by Easton Neighborhoods. Adapted from the Easton Matters: Evaluation Report, by S. Frankel & E. Golden, 2017.
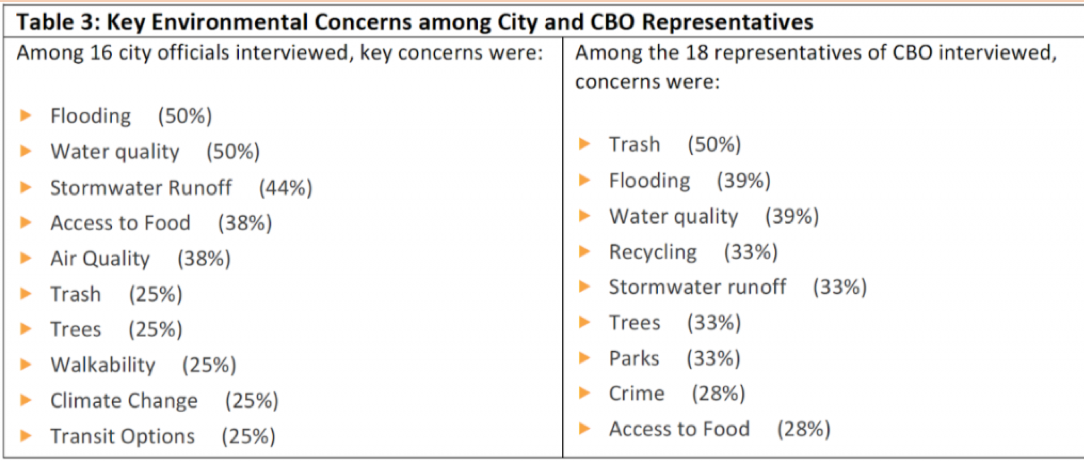
Figure 10. City Officials and CBO Representative responses to Environmental Issues. Adapted from The Easton Matters: Evaluation Report, by S. Frankel & E. Goldman, 2017.
To read the Political Context section of our report, click here.