Costs and Benefits of PHEV’s
PHEV’s provide many advantages over both internal combustion engine powered vehicles, and traditional hybrid vehicles. The fact that a PHEV can charge its battery directly from the grid is its greatest strength, this reduces fuel consumption drastically. It provides a 40-60% reduction in petroleum consumption, which results in a 30-60% reduction in greenhouse gas emissions. This reduction in fuel consumption also saves the consumer money because from electrical sources it only costs about one dollar per gallon of gas equivalent.
This dependency on electrical power results in the annual emissions being heavily tied to the greenhouse gas intensity of the electrical generation. The alternative fuels data center uses an elaborate model which predicts the well-to-wheel emissions of various cars based off of the makeup of the electricity sources. This can be found for any ZIP code in the United States by clicking here. From that link two comparisons were found, for the US average electricity generation, and that locally found in Easton, PA.
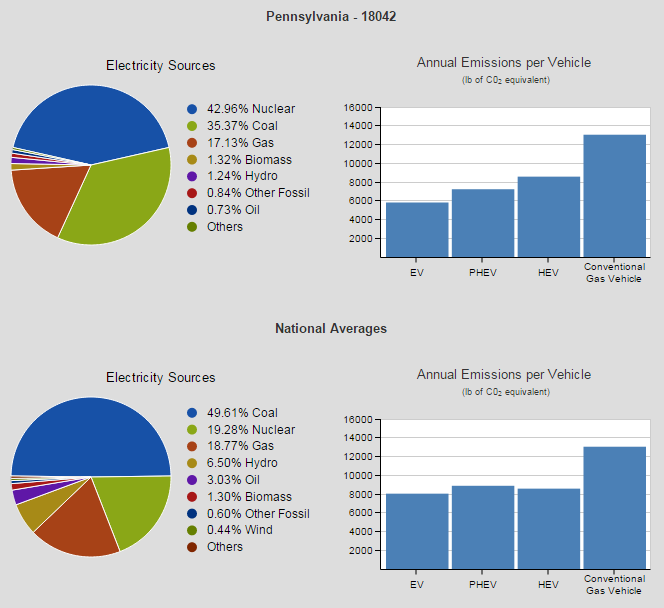
This figure demonstrates the importance of the electricity source to the effectiveness of vehicles which are charged from the grid. Easton’s power comes from a large amount of nuclear energy which has very low greenhouse gas emissions. The impact of that is clearly demonstrated by EV’s having the lowest annual emissions, followed by PHEV’s and HEV’s. When comparing that to the national average electricity sourcing the benefit of grid charged vehicles is dramatically reduced. PHEV’s actually account for more annual emissions than HEV’s and EV’s only eliminate 500 lbs of CO2 equivlent per year.
The source of power generation varies greatly by location, time of day, climate and time of the year. This causes electrically charged vehicles’ emission impact to be a function of all of these different factors. The two most drastic variables in weather a vehicle will have a considerable emissions impact are the time of day that the vehicle is charges and the location that it is charged. Time of day is especially important in the summer when there is the most electrical use. Figure 2 shows the power generation source as a function of time of day.
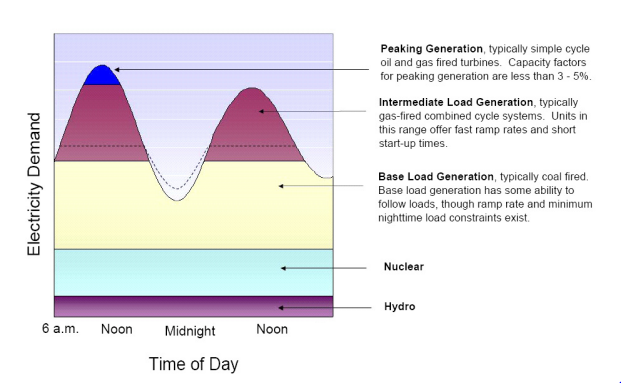
Figure 2 demonstrates that at various times of the day the source of electricity generation can vary greatly, this could have a dramatic impact on the emission benefits of PHEV’s. The difference between charging a vehicle at 6 pm vs 10 pm can be dramatic during high generation times. The second impact is the part of the grid that your car is being powered on, the equivalent MPG of a PHEV powered in each of the power grids in the US is shown in Figure 3.
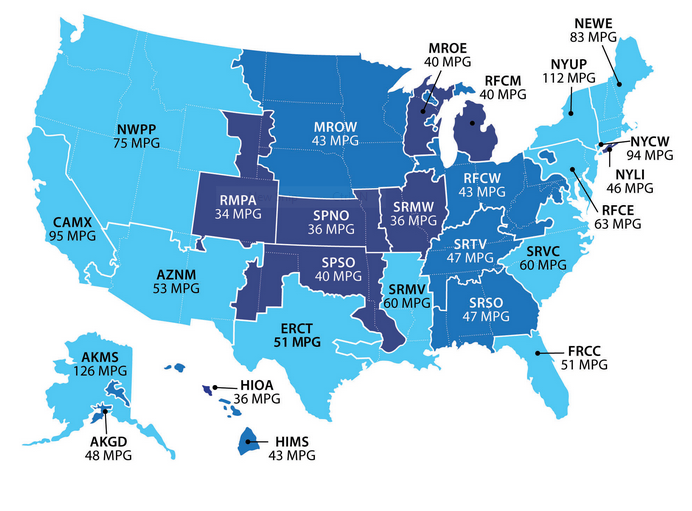
Figure 3 again shows the dramatic effect of electrical sourcing on equivalent MPG. If you are going to purchase a PHEV, it would be prudent to take this into account because based on the electrical source there could be no emissions benefit of your purchase.
When discussing the net benefit of owning a hybrid vehicles, the life cycle analysis of the vehicle needs to be taken into account. There are many variations of the life cycle analyses, the one used in the model in Figure 1 was a well-to-wheels (WTW) analysis, which does not factor in emissions from fabrication. Factoring in the fabrication is crucial to these analyses because of the batteries used in these cars. Batteries require highly intensive mining to extract the components, and causes highly toxic emissions into the environment. These may not be greenhouse emissions, but the increased toxicity of the components in electric vehicles is staggering. Figure 4 shows the toxicity of a battery electric vehicle compared to that of internal combustion vehicles, it is safe to assume that a PHEV will fall in between the BEV and ICE statistic because of the smaller batteries and motors.
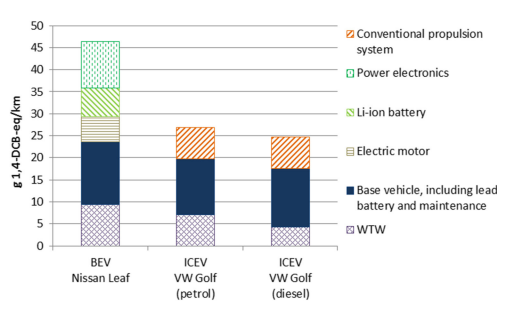
This figure demonstrates that there clearly is more than meets the eye when discussing WTW analyses and just solely looking at greenhouse gas emissions. This figure shows that a BEV emits almost twice the 1,4-dichlorobenzene equivalent than the internal combustion engine vehicles. This unit on measure for human toxicity potential is used because it is a prominent pesticide.
Battery technology is also one of the limiting factors to growth in this field, the limited electrical range of these cars comes at a huge cost and tends to degrade with time. This degradation could cause for a costly battery replacement which not only could reduce the economic viability of owning a PHEV, but it could also eliminate the environmental benefit.
References
Aguirre, K., Eisenhardt, L., Lim, C., & Nelson, B. (2012). Lifecycle analysis comparison of a battery electric vehicle and a conventional gasoline vehicle. California Air Resources Board,
Elgowainy, A., Burnham, A., Wang, M., Molburg, J., & Rousseau, A. (2009). Well-to-wheels energy use and greenhouse gas emissions analysis of plug-in hybrid electric vehicles. Argonne National Laboratory,
Samaras, C., & Meisterling, K. (2008). Life cycle assessment of greenhouse gas emissions from plug-in hybrid vehicles: Implications for policy. Environment Science Technology,
Union of Concerned Scientists. How do plug-in hybrid electric cars work? Retrieved 4/19, 2015, from http://www.ucsusa.org/clean-vehicles/electric-vehicles/how-do-plug-in-hybrid-electric-cars-work#.VTQRp9VT628
Nordelof, A., Messagie, M., Tillman, A., Soderman, M., & Mierlo, J. (2013). Environmental impacts of hybrid, plug-in hybrid, and battery electric vehicles. Modern Individual Mobility,
Author: Justin Pié
Editor: Raji Gunasekera