Environmental Impact of Switching to an Electric Vehicle
Energy Efficiency
The best way to analyze the environmental impact that a user will have if they decide to switch to a fully electric vehicle is to do a ‘well-to-wheels’ analysis across all operating systems. A well-to-wheel analysis takes into account all the emissions produced starting with the process by which the energy is extracted – from the ‘well’ – to the energy delivered to the wheels of the vehicle. Due to it taking into account all energy losses across the entire process, it is considered a complete energy comparison across all operating systems. The average well-to-wheel efficiency for ICE vehicles ranges between 17-21% (U.S. EPA). FCEVs efficiency ranges between 36-44%. Fully electric vehicles (EV) boast a well-to-wheel efficiency of converting between 59-62% from the electricity at the grid to power at the wheels (U.S. EPA). For more information on how a well-to-wheel analysis is performed, click here.
Air Pollutants
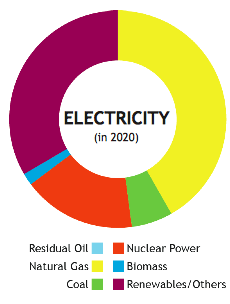
All air pollutants generated by EVs are associated with the method by which the electricity was produced. For this reason, a well-to-wheel analysis is again useful when comparing GHG emissions across all operating systems. The process by which electricity is generated is also a useful metric to consider. If electricity is produced via a clean-energy process such as hydro, solar, wind, or nuclear, then the air pollutants generated by EVs are essentially 0. One such study by California Fuel Cell Partnership (CAFCP) projects the fuel used to produce electricity by the year 2020, and the results are shown in Figure 1 below.
When considering air pollutants, the most harmful GHG to the environment is arguably CO2. Upon doing a well-to-wheel analysis, it is possible to generate data for total GHG emissions across all operating systems. Figure 2 below shows the results of one such study, showing three cases for EV vehicles operating on electricity generated from natural gas with varying turbine efficiency (50%, 40%, and 30%). Note that the EV vehicles have no GHG emission due to vehicle operation. This means that the environmental harm you are doing when driving a conventional ICE is much greater in densely populated areas, where the tailpipe emissions are having a direct effect on the people around you and air quality is more of a concern. For this reason it is plausible to conclude that switching to an EV in urban areas would have a greater environmental benefit than somewhere less populated. GHG emissions are reported in grams per CO2 per kilometer. If you want more information on how these were calculated and to view this study, click here.
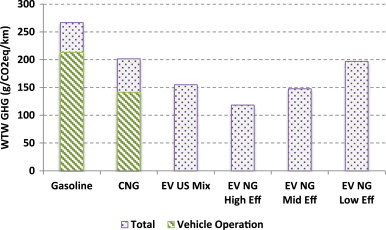
As you can see in Figure 2, driving an EV vehicle with electricity produced from a natural gas plant with low turbine efficiency can be just as harmful as a compressed natural gas (CNG) vehicle in terms of total CO2 emission. On the contrary, if the electricity is produced at a plant with high turbine efficiency, the CO2 produced is significantly less than the CNG vehicle and more than half of that than the gasoline powered vehicle. While it is true that when you plug into the grid you have no idea how the electricity you are receiving was produced, it is something to think about in terms of how much good you are actually doing. This highlights the fact that the environmental benefits of using an EV rely solely on technological advancements of how we are producing the electricity.
Environmental Policies
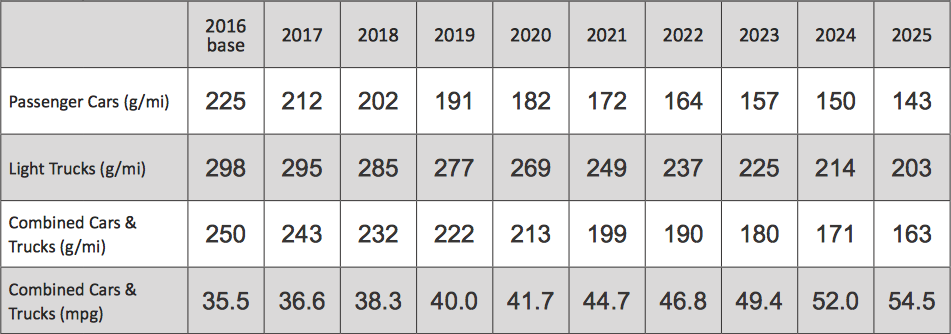
There are many incentive based governmental regulations surrounding EVs, all varying by state. Some of the more appealing benefits are, but not limited to: high occupancy vehicle lane exemptions, monetary incentives such as tax exceptions or credits, parking incentives, and registration fee reductions. If you would like to find out what incentives your state has to offer for switching to an EV, as well as federal incentives click here. Environmental regulations are as strict as ever, and the standard set by the Environmental Protection Agency (EPA) on vehicles CO2 emission produced decreased each year. The table below shows the current projected standard for fleet-wide vehicle CO2 emissions through the year 2025 set by the EPA. Notice that the emission standard is almost half in 2025 the projected standard in 2016. Notice that an increase in the car’s mpg corresponds to a decrease in the standard allowable CO2 emission per mile, as one would expect.
References:
http://www.afdc.energy.gov/fuels/electricity.html
http://www.epa.gov/oms/climate/documents/420f12051.pdf
http://www.pluginamerica.org/incentives
http://www.eia.gov/tools/faqs/faq.cfm?id=427&t=3