General geology:
When developing a project that alters the land by development, it is important to include a geologic index to the local geology. Different rock types can affect what type of materials should be used for construction. LaFarm lays in an area made of dolomites that make up part of the Beekmantown Group Formations. The geology of LaFarm lays on two subgroups within the Beekmantown, which are the Rickenbach Dolomite and Epler Formation (USGS). Rickenbach Dolomite (Or) is the older of the two groups and mainly consists of various types of dolomite. Dolomite is a fine grain anhydrous carbonate mineral, typically composed of calcium magnesium carbonate (CaMg(CO3)2) and if a rock type is termed as dolomite when it makes up a large enough portion of the bed. In this case, the Rickenbach is made of varying sizes of dolomite with abundance of silt and sand grains and some conglomerates (USGS). Overall, in outcrop, this mix of grains gives the rock a “dirty” look, but the upper portion of the formation is more finely grained, which is what we will have to handle when it comes to building. However, due to the nature of the farm laying over two beds, we cannot confirm this until we dig down to it. The contact between the Rickenbach Formation and the Epler Formation is transitional, meaning there is a more gradual change between the two, rather than an abrupt transition. The Epler Formation (Oe) is similar to Rickenbach, which is why they are group together within the Beekmantown Group together. The Epler Formation is made up of interbedded limestone and dolomite (USGS). The individual beds are often found finely laminated, meaning thin beds of limestone and dolomite varying between the fine beds. This information leads us to believe that fine grain dolomite and limestones lay beneath the soils. This can make more difficulties for building due to the fine grains and possible sinkholes due to the rocks being carbonates and more susceptible to weathering.
Soils:
In order to build on or into the land, it is required survey for the land development to be conducted prior to any form of construction. The soils below LaFarm are Washington silt loam (Wab) soil. Each letter in the identification of this soil has meaning behind it, along with the multiple soil horizons tell how the soils change with depth. In this case the W means well graded bedding soil, where beds of different size sediment are well separated through the soil. The horizons within the soil are labeled as Ap, Bt, and C (Northampton County Soil Maps). Ap symbolizes the top layer of the soil is a silt loam that can vary from 0-9” and the p stands pasture land, causing disturbance at the surface. Bt symbolizes the accumulation of clay silicate in someway, likely by water table in the subsurface, but can make challenges for building. The final layer in any soil horizon is almost always C, meaning parent material, which is the deposit at Earth’s surface from which the soil developed. The b of Wab symbolizes the hydrologic soil group B where water passes through the subsurface at a 10-50 micrometers per second. The soil itself is healthy, received a 85.8% – Rated higher quality on the NCCPI (National Commodity Crop Productivity Index) scale. With further data collection we may be able to learn the exact distance to the bedrock using the auger machine to dig vertically down approximately ~ 61 inches to bedrock (60-99”) before hitting the bedrock. (Whether we do this or not is dependent on the new GPR data which is still being processed). This is important knowledge to know before construction because of the nature of the soil being a mineral soil can reveal problems. The mineral characteristic makes the soils more susceptible to weathering, like the rock below, making building difficult more difficult during the construction process. A soil analysis was done at LaFarm in 2011 to test soil quality for mixed vegetable crops. A major point that came out of this study was where the farm was lacking in some nutrients while others that were exceeding the needs of the farm. The notes from the report go on more detail for LaFarm practices to try and balance out these values to become more optimum for growing vegetables at the farm. One of the major lacking qualities were in the nitrogen to be able provide for a higher crop yields. The first suggestion was for the correct amount of manure to be place across the land to supply the crop’s nitrogen requirement, stating, “For most vegetable crops apply about one ton per acre of moist crumbly poultry manure or 7 tons per acre of cattle manure for low N-Crops such as beans and peas and up to 4 times this amount for high-N crops such as broccoli, cauliflower and fresh market sweet corn.” (Soil Test Report, 2011). The other suggestions includes lime, boron, and fertilizers, but each has different effects on the soils that are both good and bad qualities for bringing the soils to the optimum conditions.
Ground Penetrating Radar (GPR):
For this project, we used Ground Penetrating Radar (GPR) to understand the subsurface. GPR allows a client to know when you dig, you will have a safe assumption of what might be in the subsurface to see any unknown utilities. Other methods, such as x-ray, electric locating, and magnetic locating, but GPR will always pick up structures other machines may not. The GPR is actual safer than X-ray procedures, no harmful materials are emitted, thus no limit tot is use on a site (CLU-IN Technologies – Ground Penetrating Radar, 2018). The GPR works by transmitting electromagnetic energy to pass information from two antenna: transmitter and receiver. There is a direct wave through the air and ground, while a indirect wave goes into the subsurface. The differences in return time transportation into the deeper earth materials is what the machine is reading by the actual by having the noggin sensor sitting against the bottom of the cart. The system reads the subsurface based on pulses of electromagnetic energy going into the ground (CLU-IN Technologies – Ground Penetrating Radar, 2018). These pulses send out energy in a cone like way, to see both in front and behind where there a cart is at a certain point. This is reason that the resulting figure will contain multiple hyperbolas due to the approach and retreat of driving over the object. The information is then sent in real time to the computer to be able to move back and forth anomalies over a straight line. This allows the surveyor to marked on the ground the location of these anomalies, so the client knows before they begin digging. Interferences that can affect GPR readings is the dielectric value of the medium we are trying to pass through, based on their conductivity. The air is the best conductor and has the lowest dielectric value, while water has one of the highest dielectric value of 81. GPR systems work best with lower dielectric values because of the high conductivity, but in the event of rain the accuracy of the data collection is weakened.
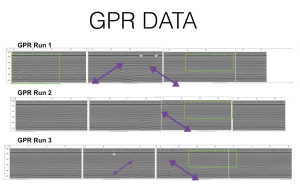
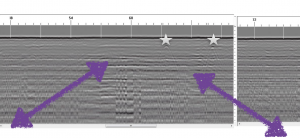
The preliminary data below was captured from a GPR unit, representing three passes over the hillslope. In turn, we were able to detect possible disturbances in the subsurface of the area intended for future excavation. Each run starts at the top of the hill and runs down slope, turning at the base of the slope to walk approximately 10 meters before turning back up the hill. The stars indicate object disturbances, in the case the first run of the two stars indicate fence posts that run along the base of the slope, at the edge of LaFarm. The third run has a star at another disturbance and we believe that it is a possible root from the top of the slope, but we say this with less confidence than the posts. The purple arrows indicate lines a horizon, possibly bedrock underneath the hill. This was a big clue into how the hill was formed because we originally thought it was the natural topography of the land, but the horizon runs in the opposite direction of the slope of the hill. This leads us to believe the hillslope is man-made and consists of fill.
The second trip to LaFarm we set up a grid system to cover a larger area of land to try and decide to try and decide where it was best to place the root cellar. Unfortunately, after the figures did not come out as clear as the preliminary data because the saturation of the soil along with using a higher frequency to try to see deeper into the ground. The saturation of the soil affected these readings because it decrease the conductivity of the soil for the electromagnetic waves trying to pass through the medium the electromagnetic waves. With more saturation, the soil becomes less conductive because water is a poor conductor. Conductor mediums are given a dielectric values based on conductivity of the medium, for example air has a value of 1 while water has a value of 81. Clay soil dielectric values varies depending on the saturation greatly having a value from 2-6 when dry and 15–40 when wet (Martinez & Byrnes, 2001). This impacted the data, but we still saw the linear artifact showing up in the data and that the soil is very likely to be a clay fill at the site.
This could lead to difficulties when it comes to building for building depending on the type of fill and whether or not it’s fine or coarse grained rock or clay. It is unclear whether or not the this will affect building, but if there is more larger cobbles of rock instead of finer grains it could lead to more difficulties in building. The green boxes are to highlight unknown noise in the data, this is found at the top of the slope so it shouldn’t cause problems of the project. The possible source could be fill with larger rocks due to more fill would have been needed at the top of the slope opposed to the slope itself. This data is important to our project because we now know there is an impermeable layer at 1.5 meters and greater as the hill slope increases in elevation. With this data we have found that there is no unknown utilities or obstructions laying under the hillslope. This means that excavation cost will not vary depending on where on the hillslope the final. location of the root cellar is placed, based on the larger grid system we set up for confirmation of the preliminary data collected.
GPR – highlight the vertical layer and the anomalies
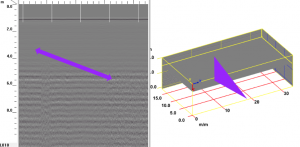
Grid System GPR
Auger:
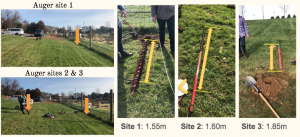
After running our preliminary runs for GPR we wanted to confirm the depth to our supposed bedrock layer we saw closest at the base of the slope and lowering as we moved up the hill slope. We used an auger drill with a rotating helical screw blade from the Lafayette Geology Department and the assistance of John Wilson. We dug a total of three holes, two at the base of the slope and one 5 meters up slope. The purpose of the auger to dig into the ground until we hit a solid layer that we believe is the bedrock. The first two holes at the base of the slope verified there is a solid layer at 1.55-1.60 meters deep. The third hole was 5 meters up slope from the the second hole and we chose to do this to verify that the solid layer does get deeper to 1.85 meters. Overall, we can conclude that there is a solid layer the auger could not drill through at 1.55-1.60 meters deep at the base and increases in depth the farther we move up slope.
Next Page: