Mid ocean Ridges are the most prominent producers of magma globally. The magma is produced by decompression melting, which occurs when two plates move away from each other. This tectonic boundary is a Divergent Boundary. Typically it produces oceanic crust and typically occurs in oceanic crust settings. The lava that is produced at these locations is typically depleted of REE elements because the source rock of the magma is from the a mantle that has been continuously melted down.
Fast vs Slow Ridges
There are two kinds of Mid Ocean Ridges: fast and slow ridges. This distinction indicates how fast the plates are spreading away from one another. There are also variations in: landforms, magma, flank topography, ridge axis landforms, crustal thickness, lithosphere thickness, distribution of volcanism, dominant eruptive products and more. Below I will discuss the difference between the two margins.
Fast Ridges:
Fast ridges can spread about 6 to 16 centimeters per year. A notable fast ridge is the East Pacific Rise, where these measurements were taken. Typically a fast spreading ridge is typically more mountainous and shallower below sea level. These volcanic mountains don’t reach as deep. This is due to the buoyancy that occurs at this location. This is due to the amount of magma produced at this location. It causes the crust above to be more buoyant.
These ridges are typically smoother because there are more consistent lave flows present at these ridges. The tectonic setting is typically longer. There is a 2-5 km rise and a small valley. This is not a rift valley, typically they are axial calderas. This is due to the caldera’s ability to let larger amounts of magma to escape quickly and consistently from these volcanoes.
There are typically extensive lava flows. The fast spreading ridges also have a larger flank area that is typically very steep. This is due to more magma being produced and erupted out. This is due to the volcano being closer to the mantle. The reason that the Fast Spreading ridges are closer to the mantle is due to the lithosphere being thinner and the crust being thicker. The lithosphere is thinner due to it being more exposed to heat from the asthenosphere.
Typically, volcanism at these ridges is wildly distributed. It typically has long continuous sources of magma. It can erupt a lot of magma over a large amount of space. Flank eruptions are common at this volcano type. Lava flows are the dominant extrusive product of Fast Ridges.
The magma at fast spreading ridges is typically more evolved. This is due to the fact that the magma that is produced is more likely to sit below the surface for an extended amount of time before it is erupted. This can lead to crystallization of some of the minerals leaving behind different kinds of minerals, due to the possible crystallization of olivine and other minerals that incorporate magnesium and iron in there structures. Typically these magmas are not all that diverse, they are typically found at all of the fast spreading ridges around the world. They are mafic and their monotonous composition comes from the fact that the source rock is depleted. They have very similar minerals in them.
The axial magma chamber is laterally extensive. It is typically made up of persistent magma bodies that are mostly under the ridge. This is due to the huge magma generation that occurs at these volcanic systems. The lateral extend of partial melt zone is wider and more laterally distributed. This wide distribution of the magma at these locations allows for side eruptions to take place. These features are wide and skinny.
Slow Ridges:
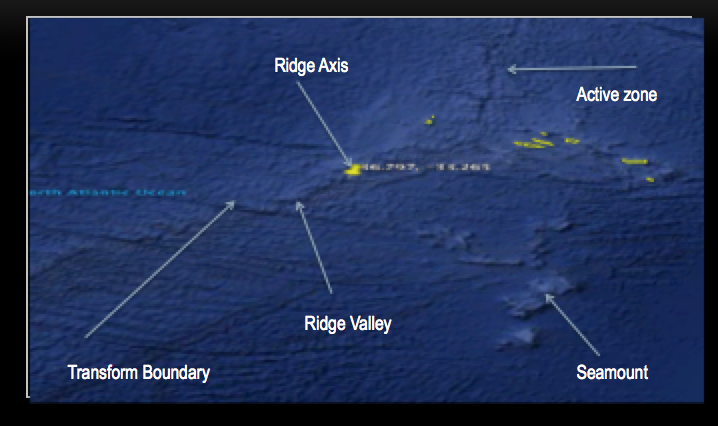
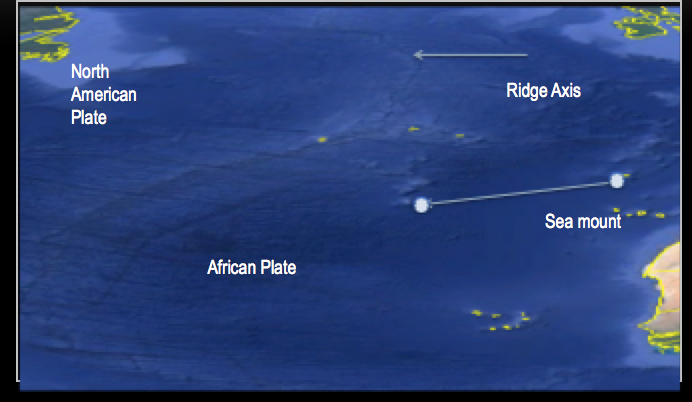
Slow ridges can spread between 2 and 5 centimeters per year. A notable example of a slow ridge is the Mid Atlantic Ridge, where the above measurements were taken. Typically a slow spreading ridge is dominant by a valley at the ridge axis. There is still a rise present and the center axis, however the dominant feature of this system is the valley. Due to the lack of lack of magma production, the This ridge is typically at the same depth as the Fast ridge, however, it is at a greater depth than the Fast Ridge (specifically at the Valley Floor). These systems typically have a narrower flank when compared to the Fast Ridge. They also have less magma generation as they are farther from the mantle.
These volcanoes typically have smaller magmatic and tectonic zones. These volcanoes are typically more craggy as they are older and colder. They also have less consistent magma generation. This volcanic system is dominated by a rift valley and a axial valley that is steep in the center. These volcanoes typically produce pillow basalts.
The crust produced by this system is typically thin and skinny because it does not have a massive magmatic output like that of a Fast Ridge. The lithosphere is thicker at these locations. This is evident in the fact that they are not producing as much magma is present. It is also more difficult to rip the lithosphere apart as it is colder. This accounts for why these ridges move at a slower pace.
Less magma is erupted in the rift valleys. There are no flank eruptions due to the minimal magma production. The dominant extrusive product that is found that this system are pillow basalts.
The magma at these locations is less evolved due to the mantle source being less depleted. However, they are all in the typical range of basalts or mafic magmas. These magmas, however can be a little more diverse locally. The axial magma chamber is typically small, localized and ephemeral as there is only a small amount of magma produced. The lateral extent of partial melt zone is narrow due to the lack of heat available to this system.
Geochemical Analysis
Here I will discuss the geochemistry of the magma located globally at Mid Ocean Ridge systems. I will describe different trends seen in different types of graphs and discuss their significance as well as any interesting patterns that are seen on these graphs. The data used for these trends take into account all the Mid ocean ridge systems globally.
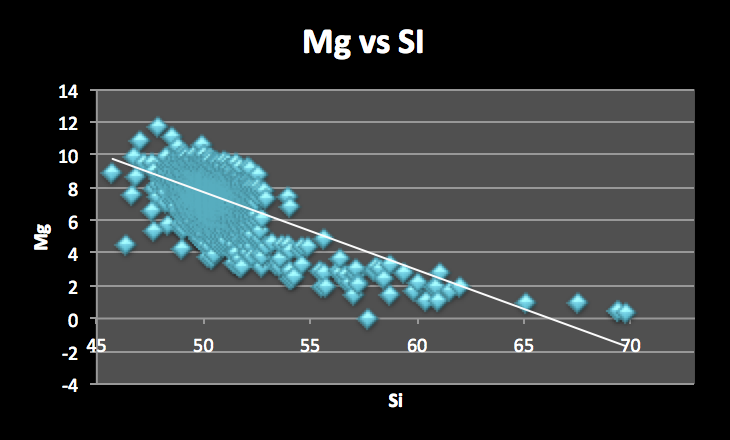
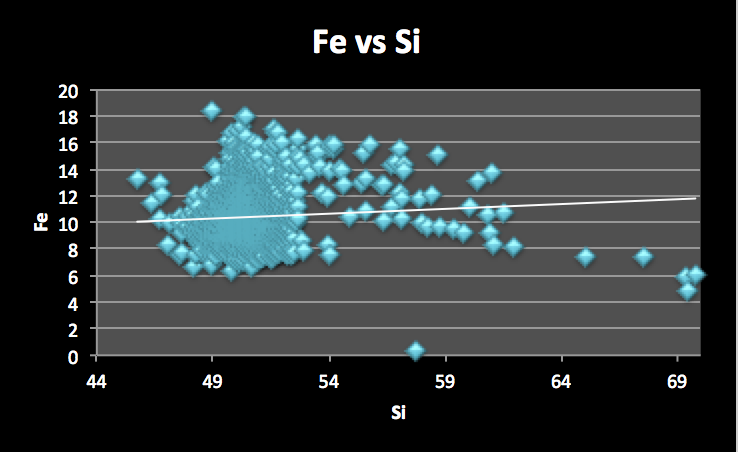
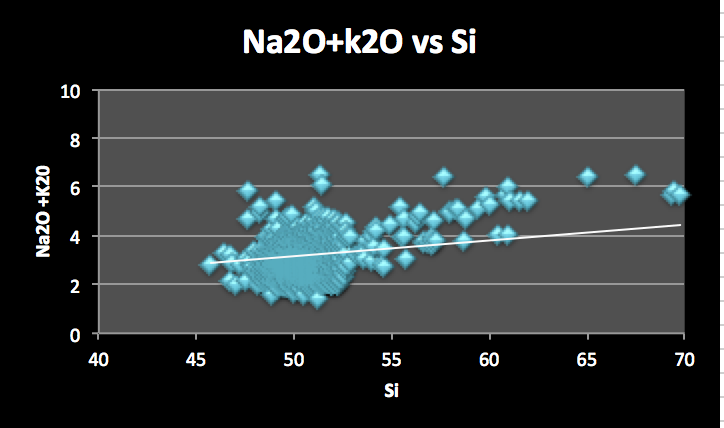
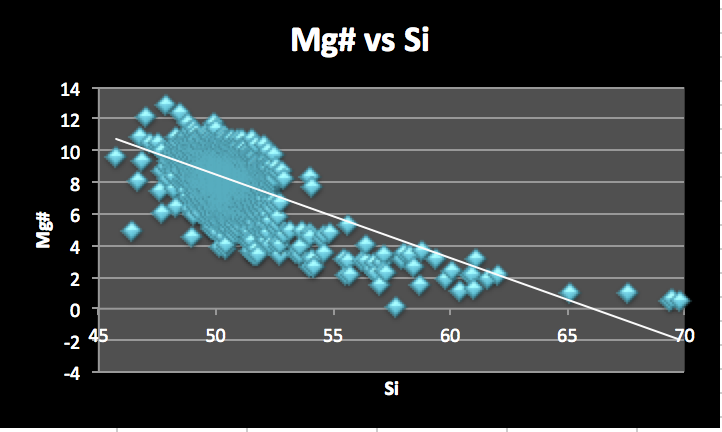
Harker Diagrams
The Harker Diagrams illustrate the abundance of elements in the sample. They typically illustrate the element and its abundance relative to Silica in the magma. The graphs in this section depict Magnesium (Mg), Iron (Fe), Calcium (Ca), Magnesium number and Alkalies (K20 and Na20) in relation the the abundance of silica (Si).

REE/Chondrite Diagram
Here we will explore Trace elements. We will look at the Lanthanide series in particular and we will explore how they measure up to normalizing them to Chondrite. A Chondrite is mediorite that we believe to have the same composition as the earth did before fractionation occurred.

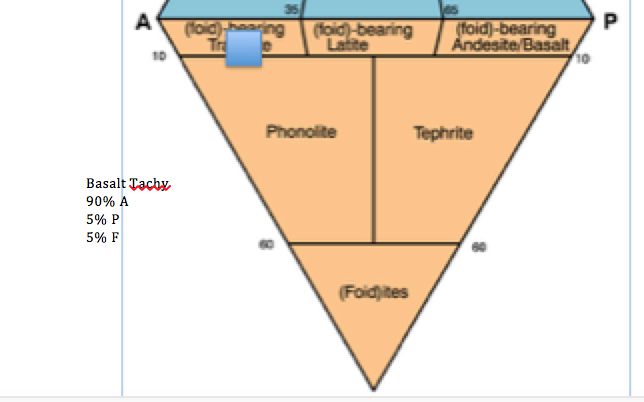
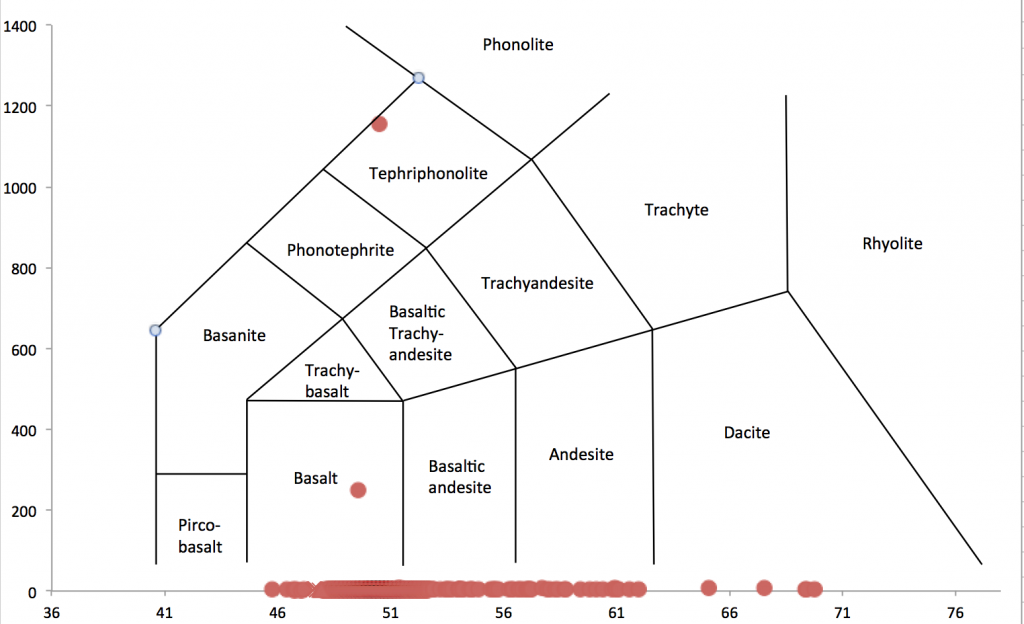
TAS Diagram
This diagram will illustrate diversity of the magma present at these ridges. It will highlight the different types of rocks that this system could produce. The X Axis Represents the silica content of the melt. The Y Axis represents the amount of alkalies (Sodium and Potassium) that are present in the melt.
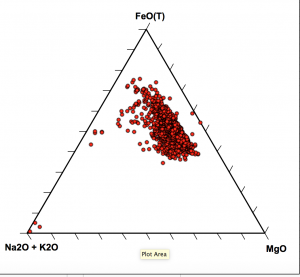
AFM Diagram
This indicates the type and evolution of the magma at the Mid Ocean Ridge. If the magma (the red dots on the graph) are closer to MGO or FeO(T) on this graph it indicates a that the melt is less evolved magma. These Magmas are typically referred to as Tholeiite magma. This is what we are seeing in the graph below. Although there are some outliers, most of the data falls in the tholeiitic range. Tholeiitic Magmas typically have a high ratio of Mg/Fe to Si.
Rocks and Thin Sections
Here we will look at the diversity of igneous rocks that can be found at Mid Ocean Ridges. We will look at one intrusive and one extrusive rock. We will classify these rocks and illustrate the textures of the rocks, the names of the minerals in the rocks and the relative abundance of the minerals in the rocks.
Intrusive:
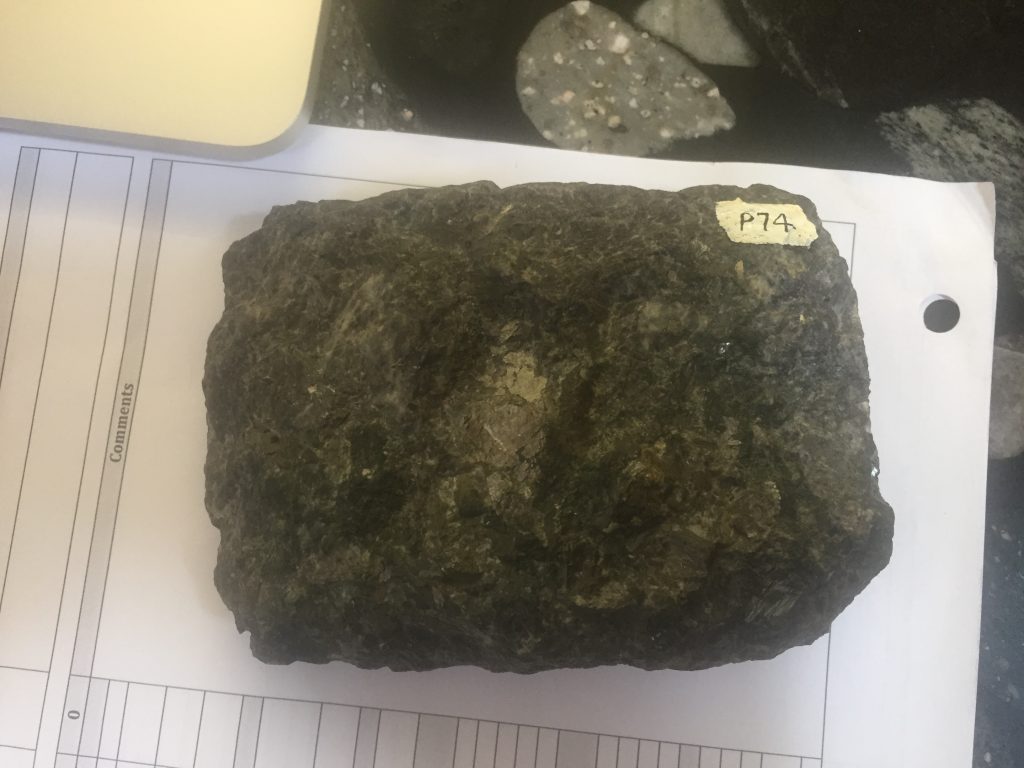
Hand Sample:
The hand sample that we will be looking at is sample number 74. You can see distinct crystals on the surface of this rock. These features represent the slow growth of the minerals in the rock.
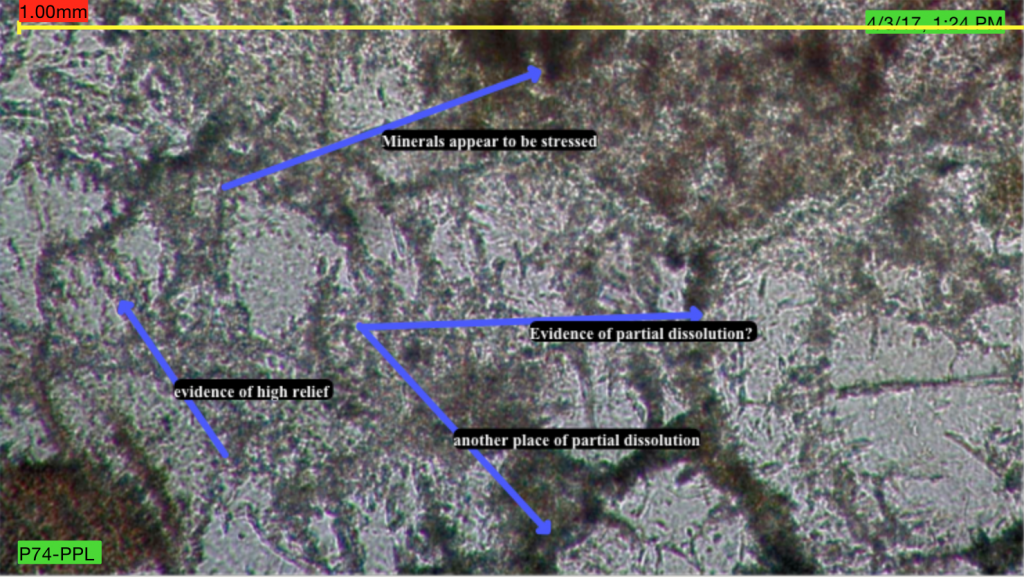
Plane Polarized Thin Section
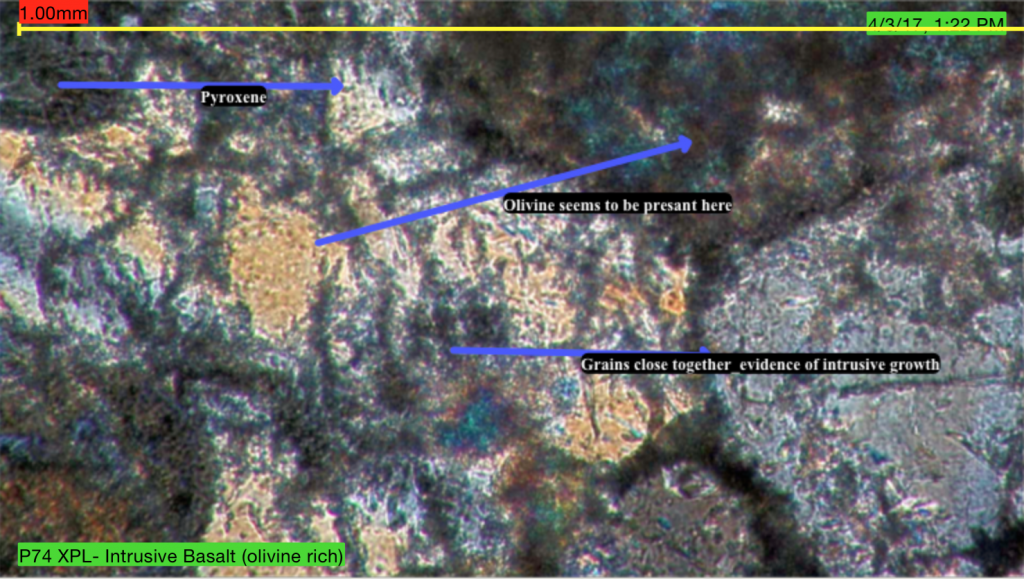
Crossed Polarized Thin Section
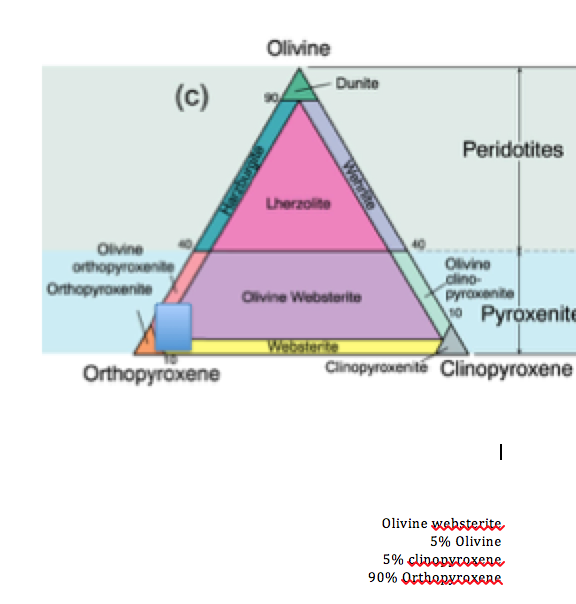
Identification Plot
Extrusive:
Hand Sample:
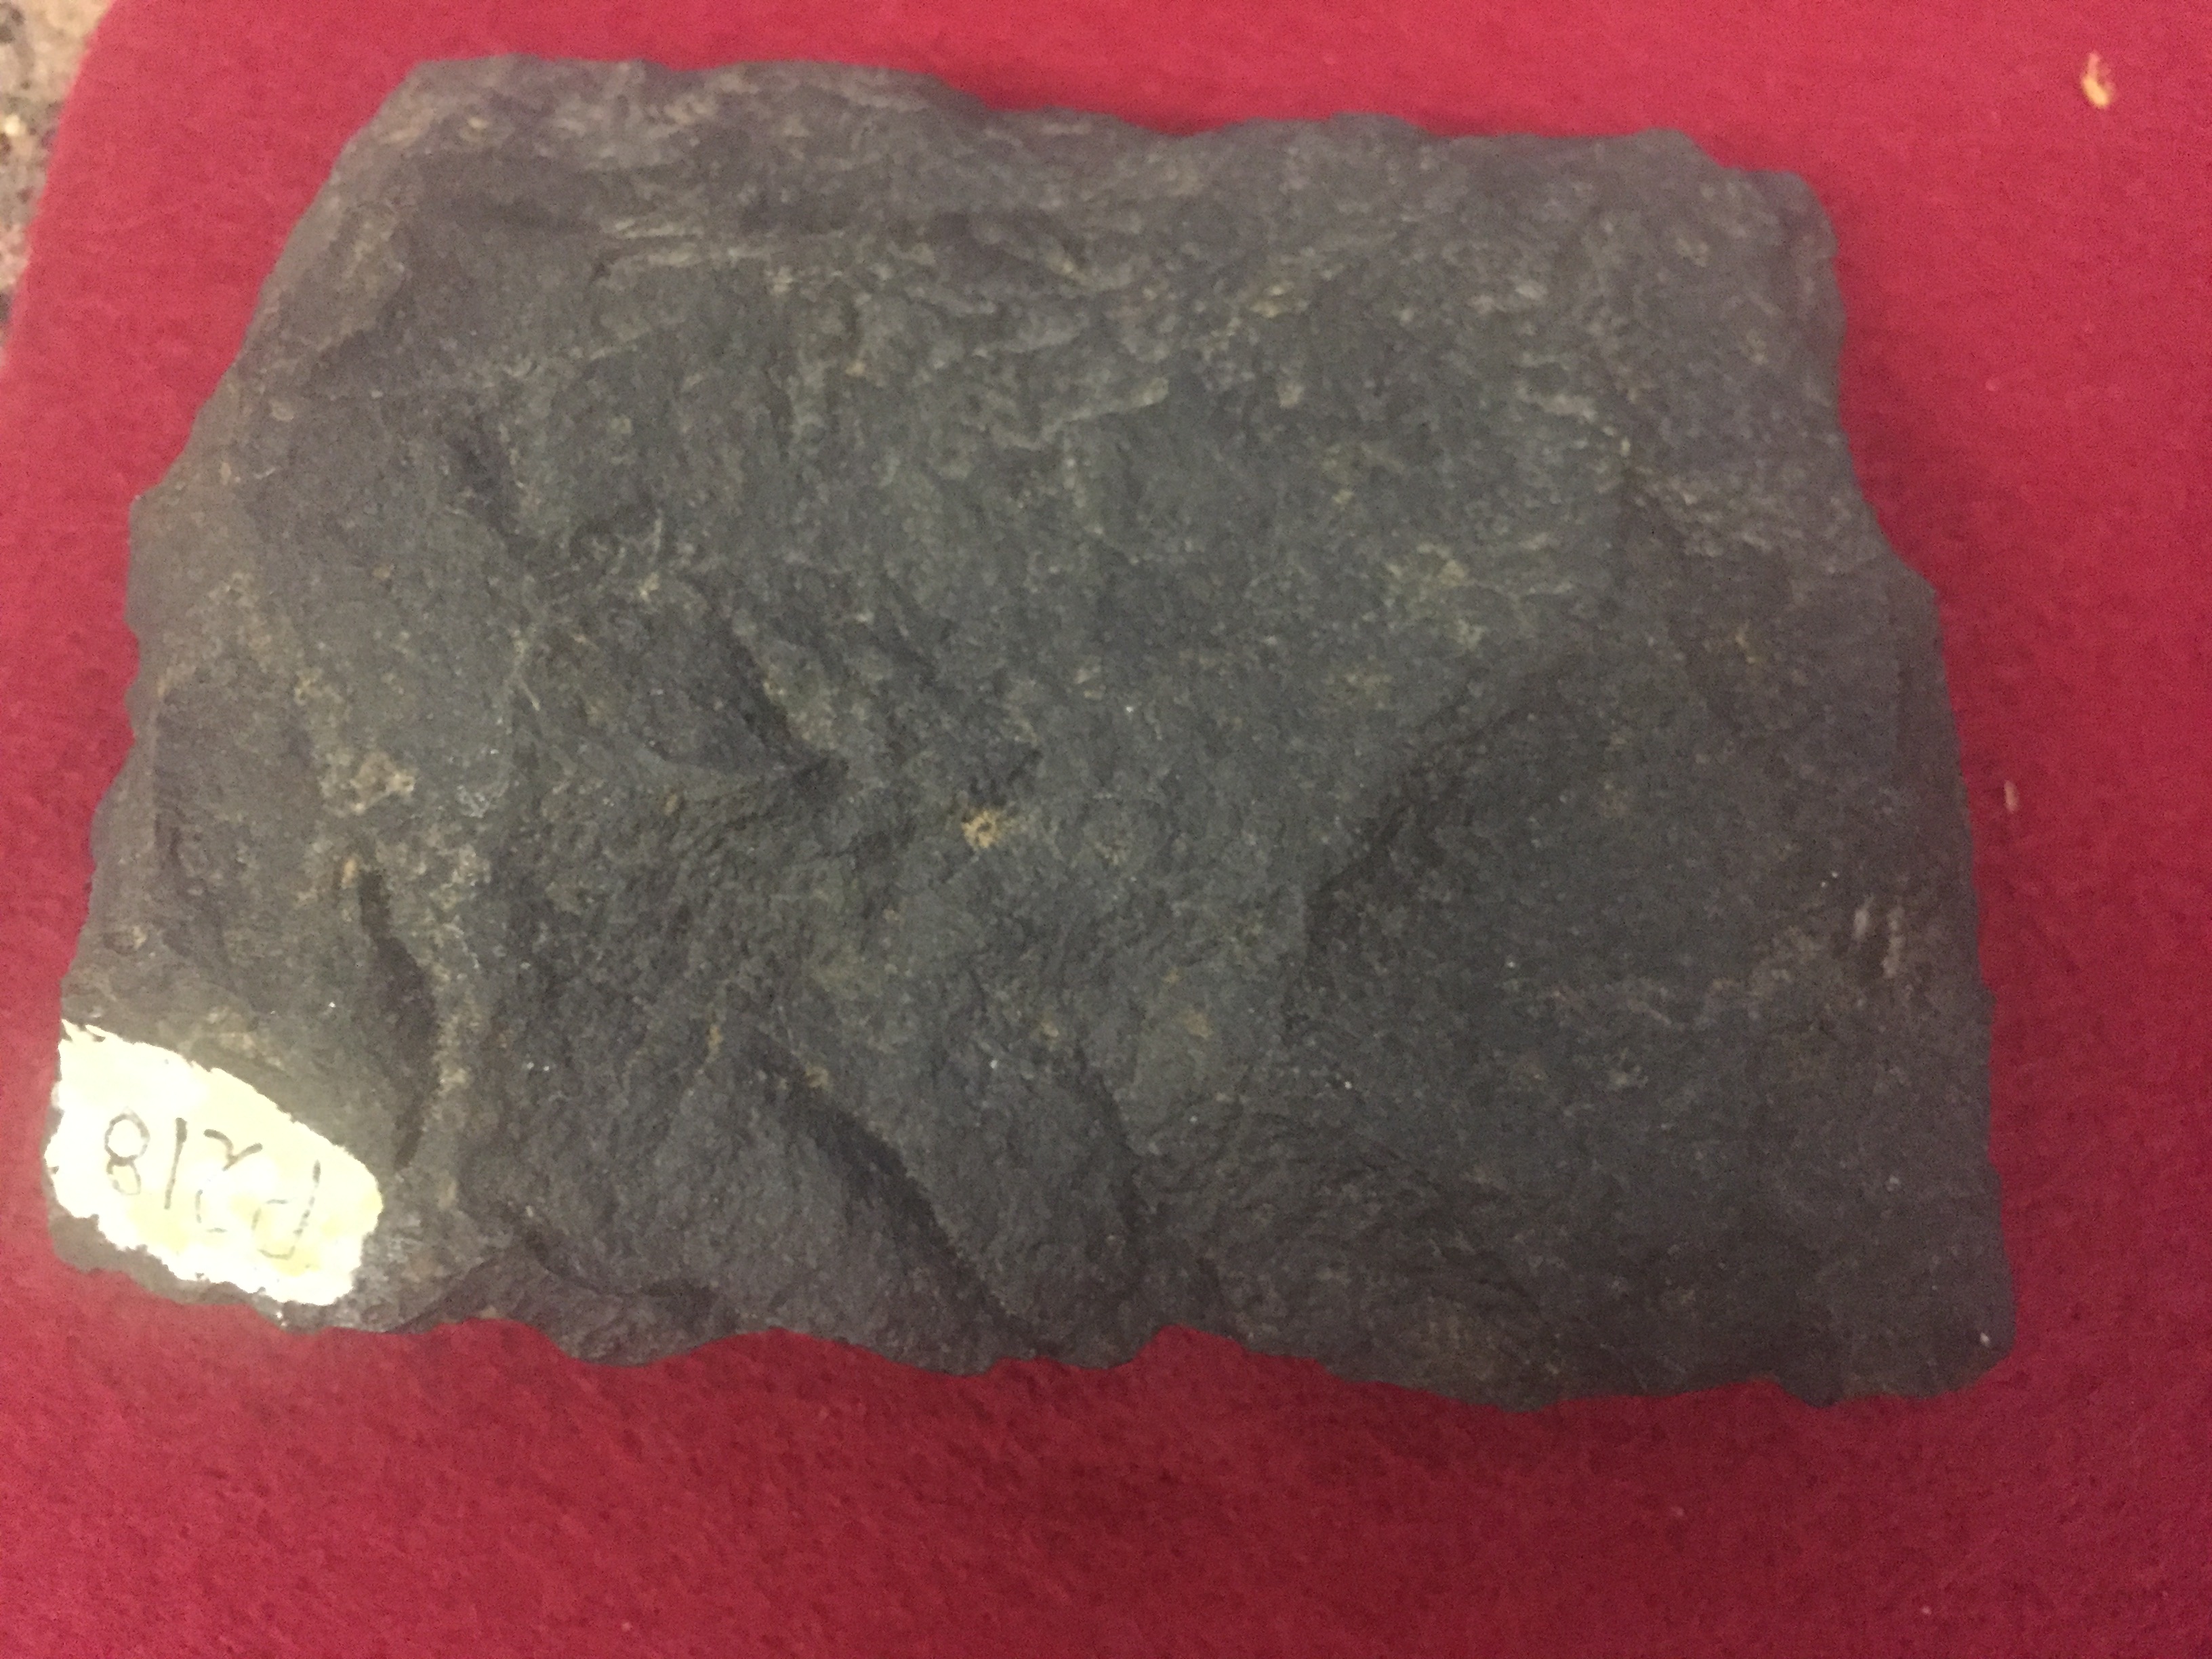
For the extrusive hand sample, I chose Sample 128. You can tell by the smooth surface of this rock that it solidified rapidly at the surface. There are no minerals present at the surface of this rock.
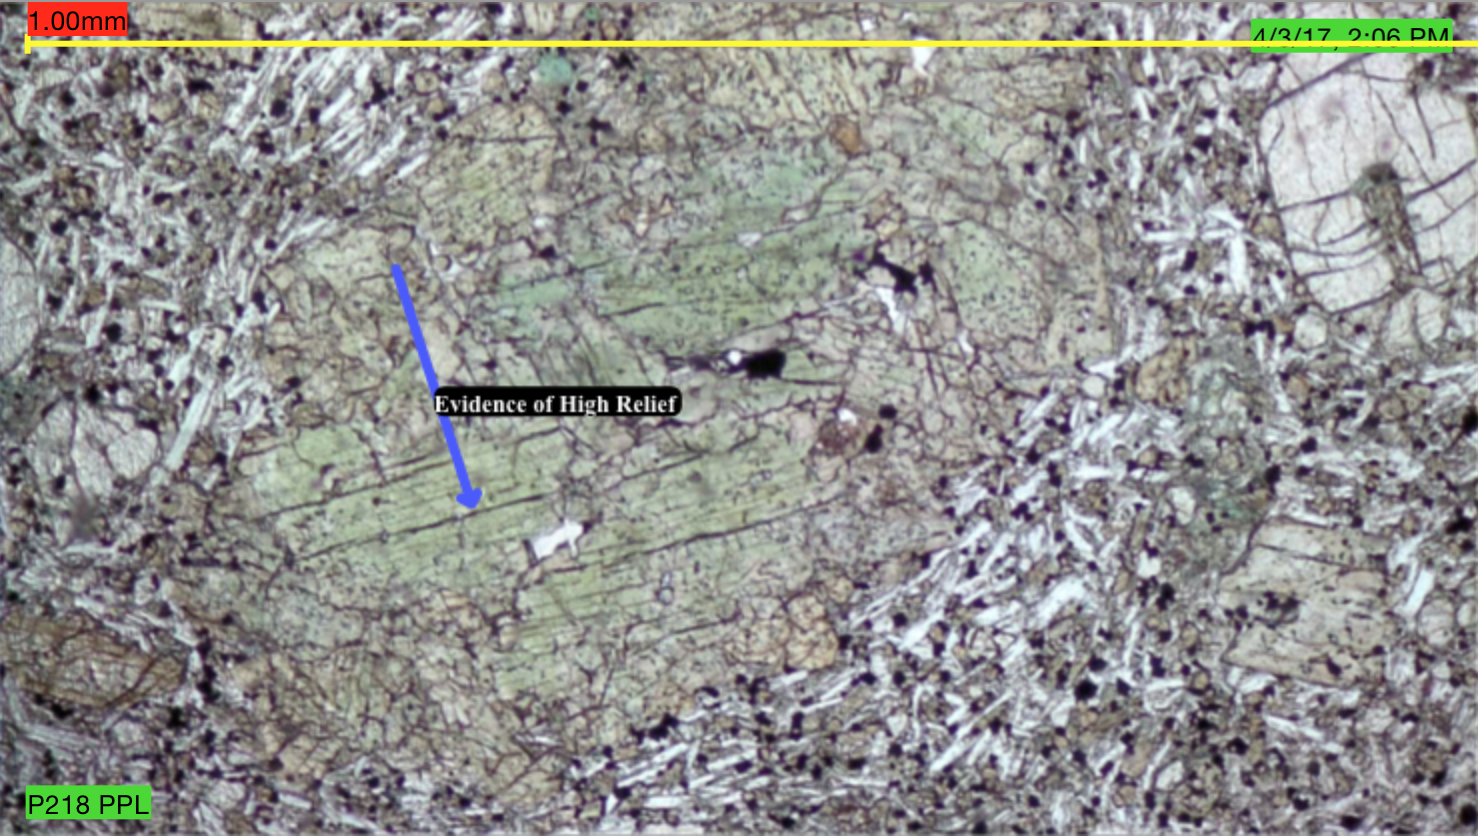
Plane Polarized Thin Section
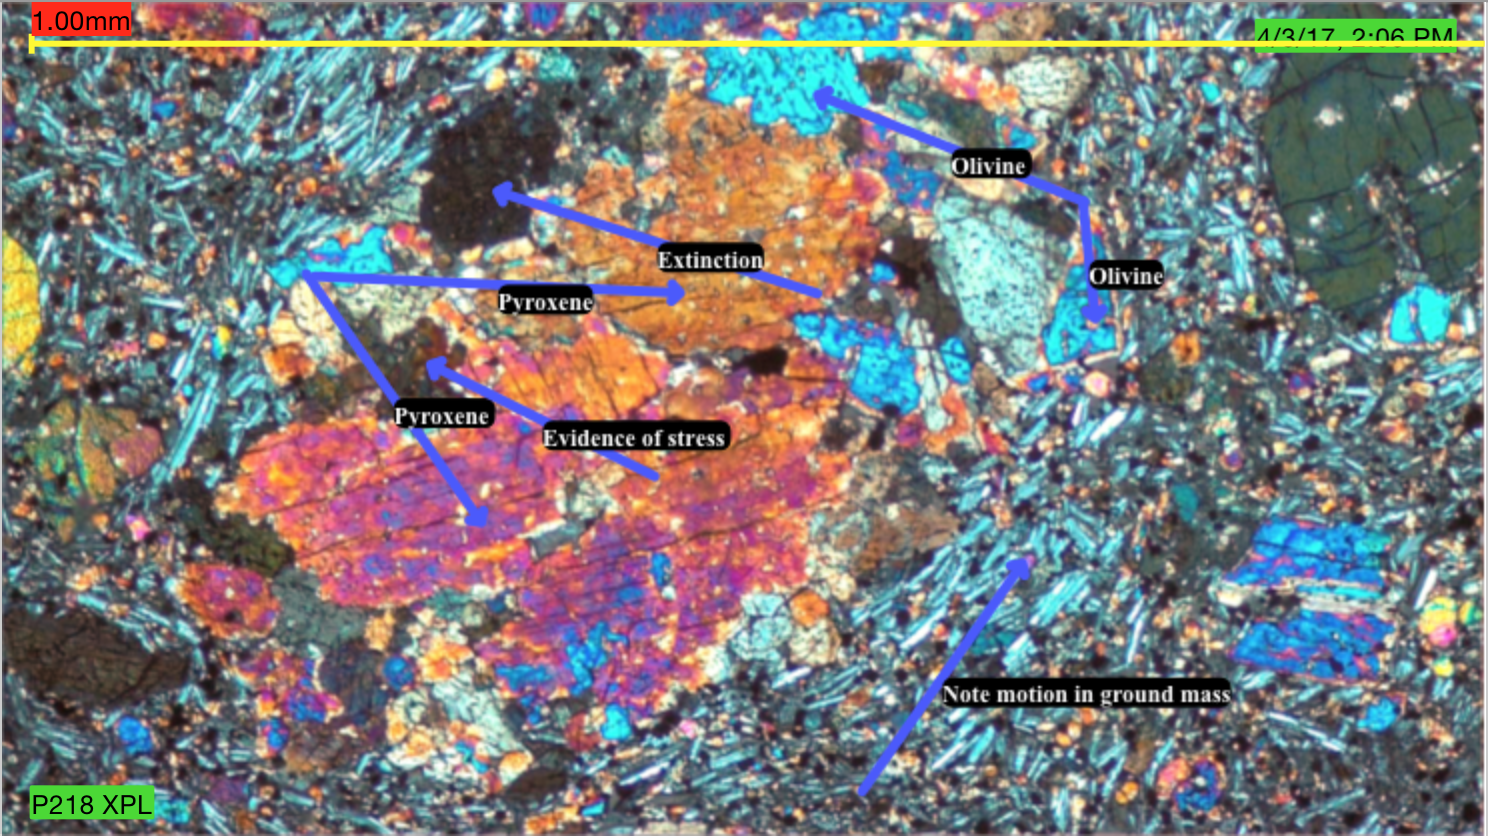
Crossed Polarized Thin Section
Identification Plot