Here I will compare the three systems more closely. I will highlight the similarities in the systems and illustrate the differences. I will also discuss the way that magma is generated in these different conditions.
Pressure-Temperature Conditions
Here I will talk about the Pressure – Temperature conditions that are necessary for the generation of magma. Mid Ocean Ridges, Subduction Zones and Ocean Islands generate magma in different ways. I will discuss this more below when I specifically describe the conditions necessary to generate magma at these different places.
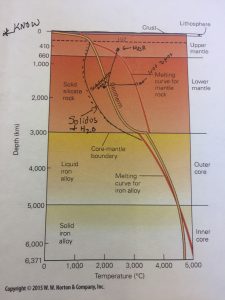
Magma at the Mid ocean ridge system is generated from decompression melting. When two plates pull apart they form a void. The mantle material moves into the the void space and liquifies do to the decrease in pressure.
Magma at the subduction zones is formed from adding water into the system. The water comes from the sediments on the subducting slab as well as hydrous minerals. The water molecules move quickly due to the heat and cause the overriding slab to melt.
Magma at an Ocean Island system is complicated. There is an increase in temperature which causes the melting to occur. Many think that this increase in heat might come from convention cells or from the outer core.
Landforms
Each of the different tectonic settings has different types of landforms.
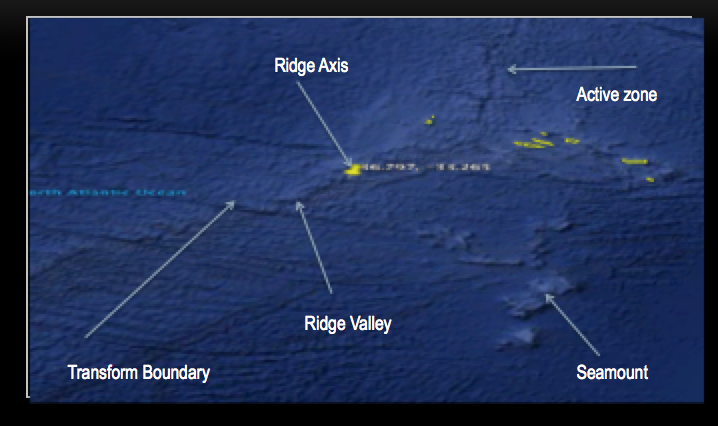
Mid ocean ridges are typically dominated by undersea mountains, ridges, valleys, and broad expanses on the flanks which can have eruptive properties. Transform boundaries are also typical at these locations. Below, I highlight these important features on the Mid Atlantic Ridge.
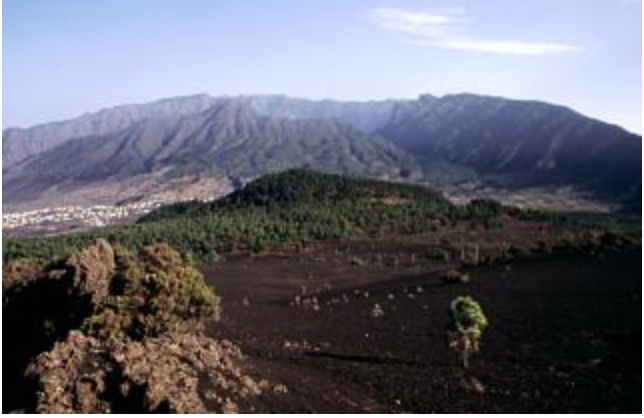
Ocean islands are typically dominated by volcanic islands and seamounts. These typically highlight the motion of the plate. Seamounts are the older islands that used to be above the hot spot that are no longer above the surface. There are many types of landforms on these islands. The islands can have calderas, pyroclastic cones, lava domes and other smaller features. Below I will show one of the volcanoes found on the active island in the Canary Islands.
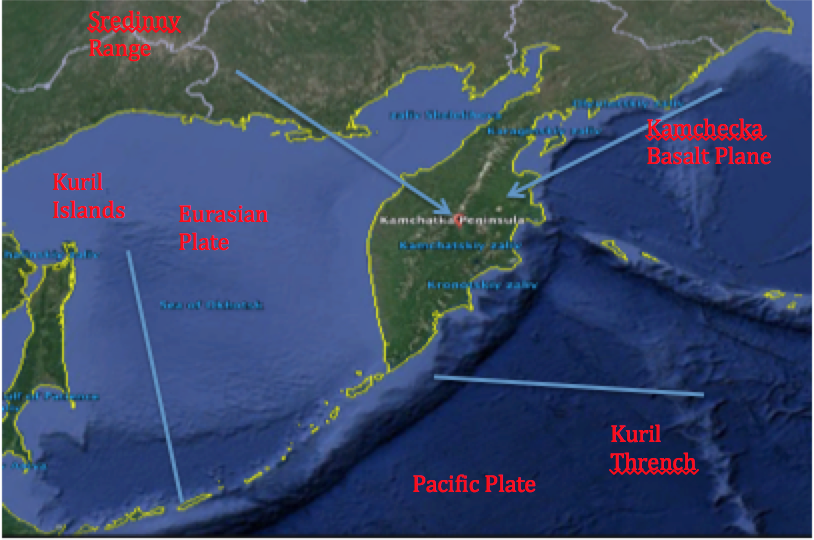
At subduction zones you can get a wide range of volcanic landforms. Lava flows can make up peninsulas where the volcanoes sit. There is typically a volcanic mountain chain that forms from the subduction of one plate under the other. Also, volcanic islands can also form due to the subduction of one oceanic plate under the other. Below I will highlight these landforms and where they can be found along the Kamchecka range in Russia.
Geochemistry
Here I will highlight the geochemical trends found at these different Volcanic systems around the world.
Harker Diagrams
Here I will compare the different Harker diagrams. To begin with I will illustrate the trends found in each of these Harker Diagrams.
Magnesium
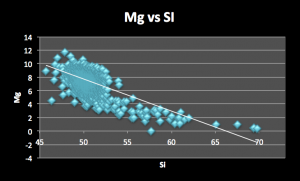
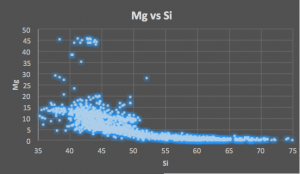
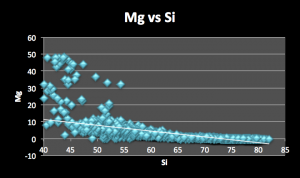
On the left is the Magnesium plot from the Mid Ocean Ridge. The middle Magnesium plot is from the Mid Ocean Island data. And finally the Magnesium plot on the right is from the Subduction Zone. Typically, the trend for this element is typically a steep decline in the magma as it is a small cation it leave the magma relatively quickly. As you can see, there is a gradual decrease in magnesium as you look at the plots from left to right. This is due to the amount of time that the magma spends underground. At the Mid Ocean Ridge, the magma spends very little time under ground and erupts relatively quickly. This fast turnover accounts for the large amount of Magnesium present in the melt. However, over time the amount of magnesium present in the Mid Ocean Ridge condition does decrease rapidly. At the Ocean Island condition you can see that the magnesium in the magma is also decreasing rapidly. Finally, in the Subduction Zone there is very little magnesium to begin with. This is due to the fact that the magma at the subduction zone stays in the crust for a longer amount of time. The magnesium is easy to crystalize out due to its size and charge. The rapid depletion indicates the extremeness of the trend.
Iron
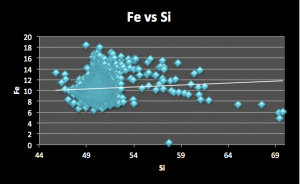
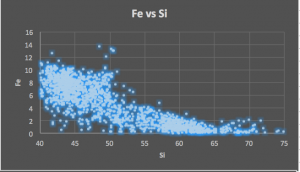
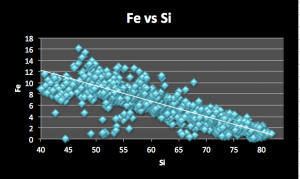
The left plot is from the Mid Ocean Ridge. The middle plot is from the Ocean Island data. The left plot is from the Subduction Zone data. The Subduction Zone data and the Ocean Island data illustrates the quick decrease of iron in the magma. Like magnesium, iron is a highly compatible element and as soon as magnesium (which is slightly more compatible than iron and bonds in the same places) crystalizes out of the melt it begins to do the same thing. However, there is a slight anomaly in the Mid Ocean Ridge data.Iron appears to illustrate an increase and then the rapid decrease which is what is expected of iron. The reason that iron might have increased might be due to the global data trend as there are some mid ocean ridges that are more rich in iron.
Mg#
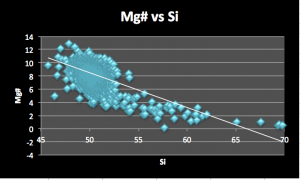
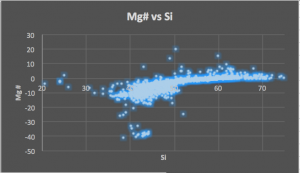
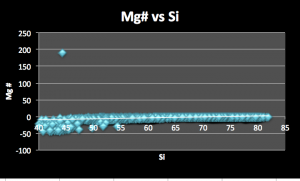
The plot on the left is from the Mid Ocean Ridge data. The center plot is the from the Ocean Island data. Finally, the plot on the right is the Subduction Zone plot. The magnesium number illustrates the ratio of the decrease of iron to magnesium in the melt. The trends depicted below indicate this trend.
Ca
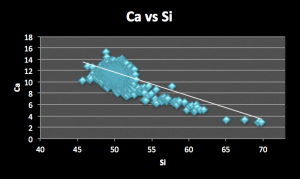
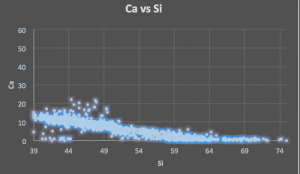
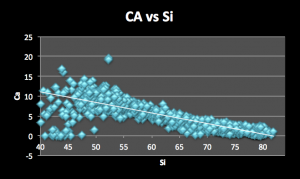
The plot on the left is the Mid Ocean Ridge plot. The center plot is the Ocean Island Plot. Finally, the plot on the right is the Subduction Zone plot. These graphs indicate the decrease in calcium in the melt. This is due to Calcium acting like Iron and leaving the melt and going into crystals when the iron has almost completely left the magma. Occasionally, you can see there appears to be an increase in calcium in the magma. This is due to it concentrating because of the lack of magnesium and iron in the solution. However, overall the decrease in Calcium is a typical trend in all three systems.
K20+Na2O
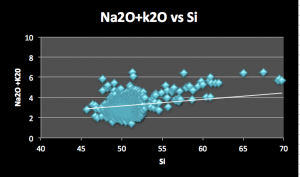
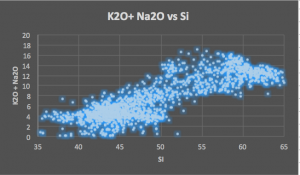
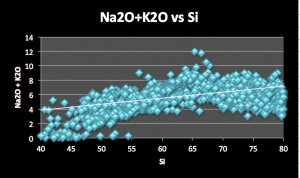
The plot on the left represents the Mid Ocean ridge system. The center plot represents the Ocean Island system. Finally, the plot on the right represents the Subduction Zone system. In all three conditions you can see the apparent increase in the the alkalies, sodium and potassium, in the melt. This is due to the fact that the more compatible elements are crystalizing out of solution. In all three of these graphs you can see this trend.
REE/ Chondrites
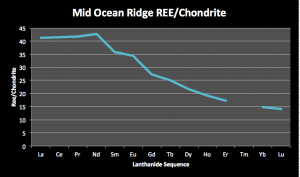
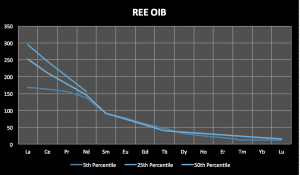
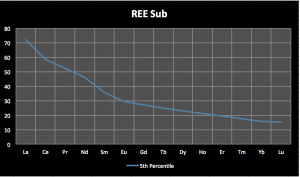
On the left is the REE/Chondrite plot for the Mid Ocean Ridge system. The center plot is for the Ocean Island system. Finally, the plot on the right is for the Subduction zone system. The Mid Ocean ridge system is representative of an enriched mantle source rock. This accounts for the increase in Light Rare Earth Elements (LREEs) and the decrease in Heavy Rare Earth Elements (HREEs). In the other two systems you can see that there is a similar trend. However, the scale is vastly different. In the Ocean Island System and the Subduction Zone System have a lot more of the LREEs than the Mid Ocean Ridge system. This is due to the difference mantle sources. Ocean Islands and Subduction Zones have a less depleted handle source to a lesser extent of melting.
AFM Diagrams
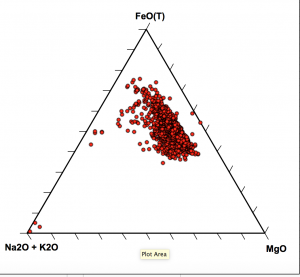
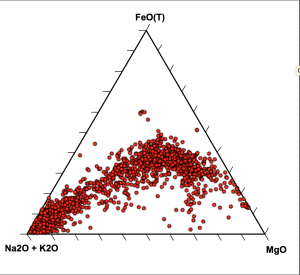
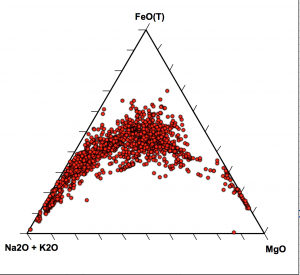
On the left is the AFM diagram from the Mid Ocean Ridge. The center AFM diagram is from the Ocean Island system. Finally, the AFM chart on the right is from the Subduction Zone system. As you can see, the Mid Ocean ridge system is less evolved than the Ocean Island System and the Subduction Zone system. However, the Ocean Island and the Subduction Zone are more similar to one another. These system show a variation between the tholeiitic magma and calc-alkaline magmas.
TAS Diagrams
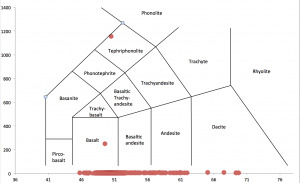
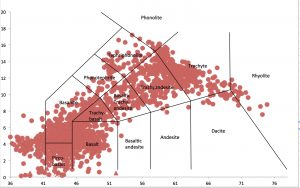
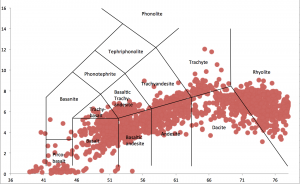
The diagrams below indicate the most variation in the rocks produced at these systems. The system on the left, it indicates the rocks found at a mid ocean ridge. The center graph represents the Ocean Island system. The one on the right represents the Subduction zone system. The Mid Ocean island graph represents very little difference in the rocks found at this system. The rocks are mostly basalt to dacite in nature. The most similar graphs are the Ocean Island and the Subduction zone. This is due to the ability of the magma to sit below the surface and crystalize different minerals out. However, all of these systems typically produce basalt.
Rocks
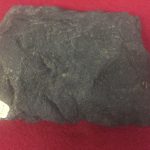
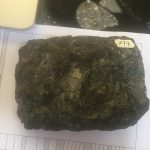
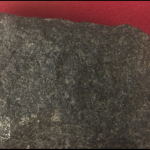
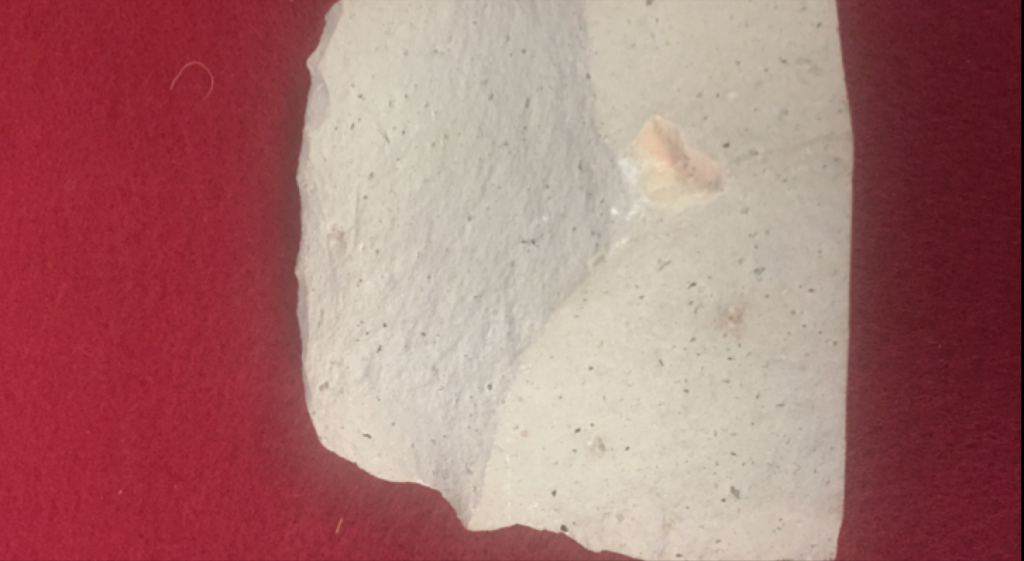
The rocks at these systems are very similar. A the Mid Ocean Ridge environment and the Ocean Island system the rocks are typically basaltic in nature. There are small variations in mineral compositions which makes them chemically different. However, they look very similar.
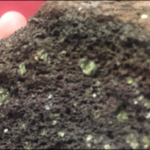
As you can see, the rocks above look very similar. The pictures below indicate the differences in the composition. Typically the ocean Island rocks are a little richer in olivine in comparison to the mid ocean ridge.
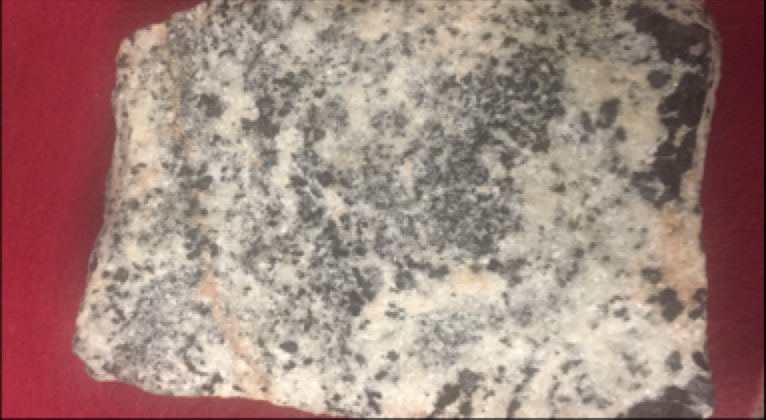
The most different rocks found at these systems is the Subduction zone. These rocks are typically richer in quartz and potassium feldspar. They are typically lighter in color.
