US Solar Electric Installations – 2012-2014
- In the U.S., the cumulative solar electric capacity in operation currently exceeds 17,500 MW, enough to power more than 3.5 million average American homes.
- With over 49,000 installations in Q3 2014, nearly 600,000 U.S. homes and businesses have now gone solar.
- Through Q3, a new solar project has been installed every 3 minutes in 2014.
- Growth in Q3 was led by the residential sector, which grew 58% over Q3 2014, and the utility-scale sector, which installed over 800 MW for the 3rd time in 12 months.
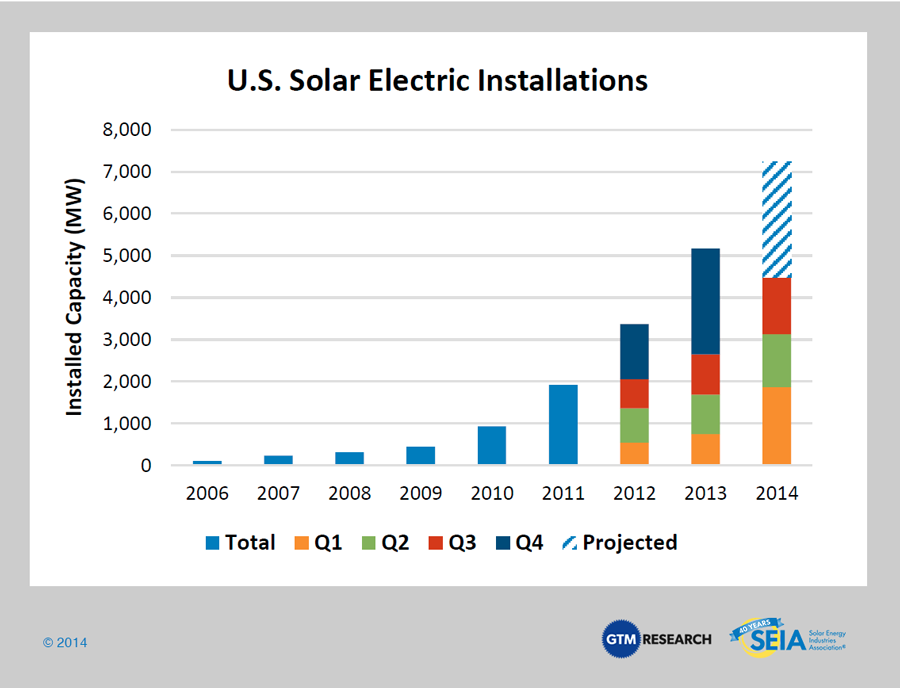
“Solar Industry Date.” Solar Energy Industries Association (SEIA). Photovoltaic (Solar Electric), n.d. Web. 27 Apr 2015. Retrieved from SEIA
- By the end of 2014 the U.S. is expected to have over 20 GW of cumulative solar electric capacity installed, roughly the same amount that is expected to be installed just from 2015-2016
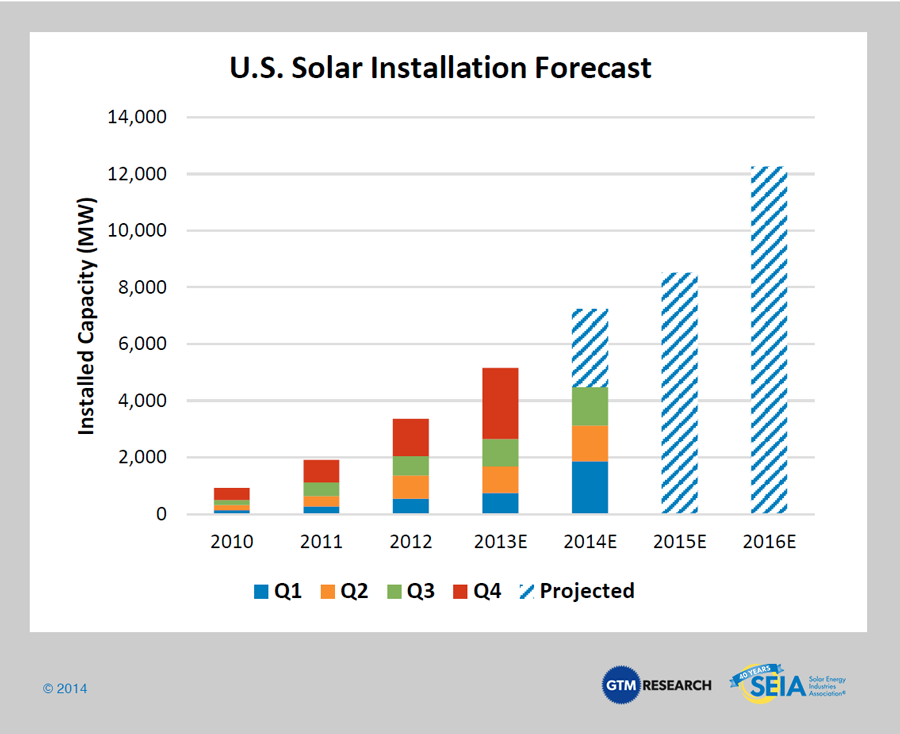
“Solar Industry Date.” Solar Energy Industries Association (SEIA). Photovoltaic (Solar Electric), n.d. Web. 27 Apr 2015. Retrieved from SEIA
Author: Hannah Goldstein
Editor: Rick Cerretani
Source:
“Solar Industry Date.” Solar Energy Industries Association (SEIA). Photovoltaic (Solar Electric), n.d. Web. 27 Apr 2015. http://www.seia.org/research-resources/solar-industry-data