Almost 30% of all U.S. global warming emissions result from America’s transportation sector. 60% of U.S. transportation emissions come from cars and light trucks which conveys the significant role exhaust from ICE passenger cars has on our environment and community health.
1 gallon of gas = 24 pounds of global warming emissions
8,887 grams CO2 per gallon of gasoline
10,180 grams CO2 per gallon of diesel
| Greenhouse Gas | Abbreviation | GWP |
| Carbon Dioxide | CO2 | 1 |
| Methane | CH4 | 25 |
| Nitrous Oxide | N2O | 298 |
| Hydrofluoric Carbon | HCF-134a | 1,430 |
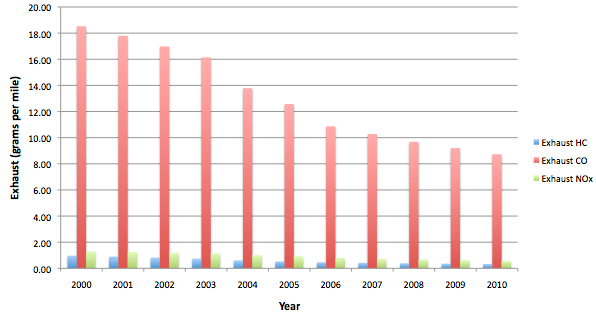
Estimated National Average Vehicle Emissions Rates per Vehicle Using Gasoline
Estimated National Average Vehicle Emissions Rates per Vehicle Using Diesel

For More ICE passenger car technology, carbon dioxide emisisons, and fuel economy trends between 1975 and 2013 click here!
The EPA regulates ICE car emissions due to the associated significant environmental and social health implications. A list of regulations and links to more detailed descriptions of the regulations are listed below.
1. National Emission Standard for Hazardous Air Pollutants
2. New Source Performance Standards
3. Standards of Performance for Stationary Compression Ignition Internal Combustion Engine
EPA Exhaust Emissions Compliance Standards
1. Tier 2 Exhaust Emissions Standards
2. Tier 3 – 2017 Implementation
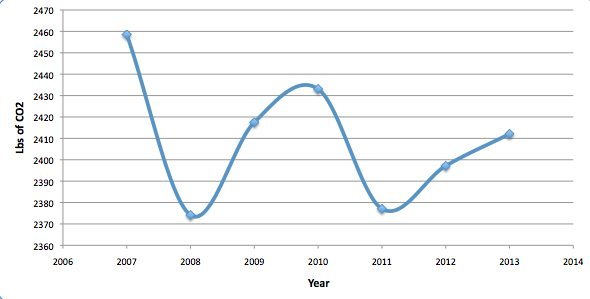
Annual CO2 Emissions in the United States
Annual GHG Emissions in the United States
|
Year |
Vehicle-Miles Per Year |
Annual CO2 Emission (lbs) |
Annual Nox Emissions (lbs) |
Annual PM10 Emissions (lbs) |
Annual PM2.5 Emissions (lbs) |
|
2013 |
2972.5 |
2412.04626 |
4.53731828 |
0.02880837 |
0.02684416 |
|
2012 |
2954.1 |
2397.11551 |
4.50923194 |
0.02863004 |
0.026678 |
|
2011 |
2929.4 |
2377.0726 |
4.47152907 |
0.02839066 |
0.02645493 |
|
2010 |
2998.4 |
2433.06291 |
4.57685286 |
0.02905938 |
0.02707806 |
|
2009 |
2979.2 |
2417.483 |
4.54754537 |
0.0288733 |
0.02690467 |
|
2008 |
2925.8 |
2374.15137 |
4.46603392 |
0.02835577 |
0.02642242 |
|
2007 |
3029.8 |
2458.54256 |
4.62478282 |
0.0293637 |
0.02736163 |
Emissions remain a concern to our society due to increasing vehicle population, increasing travel per vehicle, departures from federal standards, and a greater use of light trucks