The social context of the current transportation system to Metzger Sports Complex is one with many different angles reflecting the creation of the system. Convenient transportation has been a struggle for not only the Lafayette community but the United States as a whole. We aim to provide historical context of public transportation to allow us to recognize previous issues and give us insight into how Lafayette ended up in its current state of public transportation. Currently, Lafayette is seeing low ridership for the LCAT system traveling to Metzger Sports Complex. We will look to analyze why this is happening from a social perspective. With Lafayette’s push to be carbon neutral by 2035, we see why a public transportation system is an amazing option to ensure we are striving to that goal for the Lafayette and Easton Community. We intend to analyze cultural factors that play a role in public transportation at a national and local level.
Historical Context: The Origins of Public Transportation and Where We Are Now
Public Transportation started in the United States as early as the 1810s with steam ferry services in New York City. It then developed rapidly with electric street cars, subways, and buses as forms of public transportation. Places like New York City still have over 4 million subway users per day but the 1920s was the start of the decline of public transit (Young 2015). This decline came from the introduction of the automobile. This allowed Americans to gain more freedom and free time as they could travel to different areas regardless of where they lived. Henry Ford made the automobile more affordable to middle class Americans which really accelerated the boom of cars and the decline of public transit.
With environmental concerns on the rise today there has been a renewed interest in mass public transit (Bloom 2023). This renewed interest has been displayed by Lafayette College by putting more of a focus on increasing ridership for their public transit systems. In addition to the positive aspects environmentally, the college mainly wants to increase the system to limit the liability from students driving their personal vehicles to required events such as games or practice. This effort has been shown by putting a heavy emphasis on the topic during freshman orientation which unfortunately hasn’t been effective. In some personal interviews, a student let us know that he had not even heard of the LCAT system till junior year. This will be a key element to our solutions proposed in later sections.
The LCAT system was implemented more than 30 years ago as head of Lafayette Public Safety Jeff Troxell told us it has been around longer than he has been here, which is 30 plus years. The system started out transporting football players to Metzger as they were the only team with practices out there. We had the opportunity to talk to some of the current football coaches who were players during this time. They gave us insight that the process for them involved taking yellow school buses that hauled the whole team and staff at three different times. They expressed to us that some students drove personal vehicles while some used the shuttle service. We were informed that it was almost a rite of passage for the freshman football players, as they were expected to take the shuttle. This was due to some of the negative aspects the shuttle presented. Things like having to rush to make the bus or wait for all the players to be ready to ride back to campus, where long showers and horsing around is prevalent. This made the overall experience not as enjoyable as taking a personal vehicle, hence why it was seen as a rite of passage. Even with this, many upperclassmen still used the shuttle as it was still seen as a convenient form of transportation, whether you had a vehicle or not.
Public Transportation has always been a relevant issue in the United States. It’s something that affects so many people in their everyday lives. The US has put an influence on developing and expanding its road infrastructure over the last 30 years while public transportation hasn’t received the same intent. This has been shown by urban roadways being overall expanded by almost 67 percent, and urban interstate highways by almost 73 percent (Sen 2022). With public transportation not receiving as much attention, this has facilitated an astronomical backlog of maintenance for the sector. It is estimated that the required backlog for maintenance and repairs is $90 billion and $176 billion (Mejia 2022). Unfortunately, “the $39 billion in new transit funding provided by recent federal infrastructure legislation is less than half of the lower estimate of this maintenance backlog (and less than a quarter of the higher estimate)” (Page 12, Sen 2022). Infrastructure management in the United States is a complicated issue but the commitment to automobile systems indirectly has a negative impact on public transit. With a lack of maintenance and repairs, it makes public transit a non reliable form of transportation to work, medical appointments, and anywhere else. People are then forced to use cars in order to do these everyday needs. Unfortunately this is where we see inequalities arise. According to the U.S. Census Bureau data, about two-thirds of Black households own vehicles, compared to about 82 percent of all households and 86 percent of white households (Sen 2019, 1).
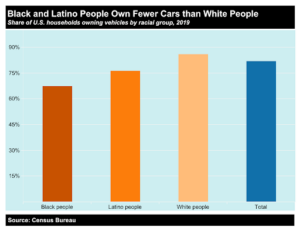
Figure 1. U.S. Census Bureau Displaying vehicle ownership by racial group (Sen, 2019)
We see a similar correlation with lower household income and car ownership. With a system that is so reliant on mobility through cars, it limits those who don’t have them. The transition to more emphasis on public transit in the US has been tough. The Bipartisan Infrastructure Bill was passed which covered a vast amount of infrastructure systems, including public rail, but has not followed through with providing the proper amount of funding for public transit as a whole (The White House, 2021). Due to our roads, highways, and bridges not being in great condition either, a substantial amount of funding was allocated for those aspects. Oil and gas companies lobbying politicians had a huge impact on what the bill actually produced. For instance, Senator Joe Manchin (D-WV) was a part of the group of senators who came up with the Bipartisan bill. While being one of the most vocal advocates for the bill, in typical Washington fashion it was no surprise that he had received “four times the contributions to the next highest recipient” from Oil and Gas companies (Sen 2019, 3). So the bill is structured to benefit automobile infrastructure over public transportation. Although, this funding to automobile infrastructure is needed with the current state our nation’s roads and bridges are in. The American Society of Civil Engineers rates bridges at a C and our road systems at a D while our public transportation grade is at a D minus (ASCE, 2021). Obviously, both of these systems are struggling and need vast improvements. The argument for better public transit in the US starts with that only 55% of Americans have access to public transit (APTA, 2023). In addition, public transit users are on the decline and this will only compound without addressing the cause of this. With a lack of demand, trip delays and reliability issues become more frequent as services have to be stopped or shortened. If this trend continues we can expect to see poorer air quality, increased traffic congestion, and a hampered economy. Cars will still be a great form of transportation in the US but with an added investment into public transit, it can seriously make both experiences more convenient, environmentally friendly, and help the economy.
Sustainability and Community Benefits
Public transportation provides huge sustainability benefits for the US and for a local region like a college. There are many benefits to public transportation but one of those is the amount of greenhouse gasses it can reduce. With more people using a shared source of transportation, it greatly reduces emissions when compared with people using their individual cars. We will provide more insight through data in the technical section. The reduction in emissions if there was a higher public transportation use is eye opening due to its large scale (Hodges, 2010). Communities receive direct benefits from aspects such as cleaner air quality, which leads to better health and safety of the community. Other positive aspects from a sustainability perspective include a reduction of harmful chemicals on the roads and in our drainage systems. Also, with a reduction in road expansion and construction, emissions from the building of these systems will be reduced. The benefits don’t stop at just environmental aspects as public transportation improves communities mobility, economic benefits, and improved road congestion. Mobility means not being restricted to do important tasks due to a lack of transportation or means. More than 3.6 million people have delayed or missed medical care because of transportation barriers (National Academies of Sciences, Engineering, and Medicine workshop, 2016). This is where we start to see real equity issues in communities as people are not being able to take care of serious needs due to a lack of a system in place. In addition, public transit can play a vital role in facilitating a well functioning economy. Through increased mobility to jobs, boost in productivity while commuting, and easier access to local businesses it can really help stem economic growth (Chen 2020). Another benefit would be road congestion becoming much less frequent for users who have to use their own vehicles.
Lafayette could experience similar benefits with a well functioning system. Right now, the system to succeed is in place but is limited by poor ridership by students. We think that better marketing and a better route can vastly improve student use. If the student use problem can be addressed, then we see these community benefits being very achievable for the Lafayette community.
The Sustainability Tracking and Rating System (STARS) provides a framework for higher education to compare their sustainability efforts to each other. Looking into a similar high education institution will allow us to determine where Lafayette is in regards to sustainability. Lafayette College last score audited in 2020 was a 52, giving the college a silver rating (Nahman, 2020). Silver is the third score out of five, gold and platinum being above. Bucknell University in 2022 was at a 67, receiving a gold rating (Udo 2022). Lafayette’s mid range score is not directly from high greenhouse gas emissions from faculty or student transportation. Although, with a transportation system that is already funded and in place, it makes total sense to optimize it as much as possible. Lehigh University is rated at a 1/1 for their sustainable transportation efforts while Lafaytte is rated at a .40/1 (McSain 2023, Nahman 2020). Further efforts to increase ridership with Lafayette’s LCAT and implementations of other sustainable transportation systems like bike sharing would help the score tremendously. While optimizing the LCAT system might have a small increase in total sustainability metrics, the college can use this opportunity to set an example as a national sustainability leader.
Cultural Factors
Many cultural factors go into the lack of use of public transportation at a national and local level. In a UC Berkeley psychology study, Kehsun Lin informs us that countries such as Australia have raised ridership significantly through bus service reliability improvements and frequency enhancements (Lin, 2010). An increased safety, comfort, and better amenities have shown to improve ridership as well. The study hypothesized that the top factor influencing frequent user willingness to ride is bus service reliability, while off-bus services, on-bus services, and safety and security measures influenced ridership less (Lin, 2010). It shows that people don’t necessarily need anything flashy or high tech, just something reliable.
At Lafayette this system has not been shown to be reliable to the community. Specifically focusing on transportation from the campus to Metzger Sports Complex. Students, fans, coaches, faculty, and other members of the community primarily use their own car to get to the facility. We created a survey to dig into the reasons why the community does not use the shuttle. We received over 50 responses from Lafayette student athletes. Questions included whether they were student athletes, if they have heard of the shuttle, why they do or don’t take the shuttle, their thoughts on improvements to the shuttle, and a few more. From a cultural perspective, we analyzed why they did or didn’t use the shuttle, why their usage was the way it is, and their improvements recommended for the shuttle. Our data backed up our predictions. We found that 71% of student athletes have never used the LCAT, while 10% have never even heard of the LCAT. A student athlete recommended “Maybe have it go to Metzger if it does not already do that.” This demonstrates a lack of knowledge of the system on campus. The data shows that even if they do know what the LCAT is, the lack of awareness of what the system actually does limits usage. This is why marketing of the shuttle will be an important solution discussed in later sections. It’s a cultural norm to not take the LCAT but similarly to the UC Berkeley study (Lin 2010), reasoning came down to reliability and convenience. National trends have shown factors such as safety, comfort, amenities, societal factors, and bias affecting public transit ridership. This is not the case at Lafayette as reliability and convenience have displayed to be the most important factors. Many of the users were not even taking the shuttle to Metzger but rather a different LCAT shuttle around campus. Most of their responses indicated they were only a short term user while injured or due to their car being in the shop. The number one response for why they didnt use the shuttle was due to having their own personal vehicle. With this, responses let us know that the inconvenience of the shuttle pick up and drop off locations and times made their car a more reliable option.