Technical analysis
Pipeline
Natural Gas Pipelines Overview
Natural gas pipelines enter the story of natural gas energy production after the hydraulic fracturing process is complete. The raw natural gas is pumped out of the wellhead and into the gathering pipeline system, which is composed of low pressure, small diameter pipes used to transport the gas to the processing plant. After the natural gas is processed it is transported to a distribution center through the transmission pipeline system at pressures ranging from 200 to 1,500 psi. Transmission pipes can measure between 6 and 48 inches but most are between 24 and 36 inches. Lateral pipes, used to deliver natural gas to or from the mainline, tend to measure between 6 and 16 inches in diameter (The transportation of natural gas, 2013). Gathering, transmission, and lateral pipelines are all made of an engineered carbon steel alloy. Along the transmission pipeline system, there must be at least one compressor station to pressurize the gas. From the distribution center, the natural gas is pumped directly to customer through the distribution pipeline system that consists of small pipes that may even be made of highly advanced plastic materials.
PennEast Pipeline Technical Details
The PennEast pipeline is planned to be approximately 108.8 miles and 36 inches in diameter, originating in Luzerne County, PA, and terminating in Mercer County, NJ. The Hellertown lateral pipeline was added in the final draft of PennEast’s Resource Report 01 (2014) that was posted on November 10th. It is planned to be approximately 2.1 miles and 24 inches in diameter located in Northampton County, PA. The proposed right-of-way (ROW) corridor will be 100 feet during construction with a 50-ft permanent easement. According to the final draft of PennEast’s Resource Report 01 (2014), 30 feet of the 50-ft permanent ROW will remain cleared in non-wetland resource areas while a 10-ft cleared corridor will be maintained in wetland resource areas. The system is rated for a maximum allowable operating pressure (MAOP) of 1,480 pounds per square inch gauge. The gas in the PennEast pipeline will be pressurized by the UGI HAZ compressor station, which will be located on a 47.7 acre property near Blakeslee in Kidder Township, Carbon County, PA. The compressor station will include 3 Taurus 70 units rated at 10,915 horsepower each under ISO conditions for a total of 32,745 available horsepower. The pipeline will have a total of 51 access roads with a total length of 22.1 miles, 11 of which will be located in Northampton County, PA. The PennEast pipeline will have four major waterbody crossings, meaning greater than 100 feet, including the Susquehanna, Lehigh, and Delaware rivers and the Beltzville Lake.
PennEast Construction Plan
According to the final draft of PennEast’s Resource Report 01 (2014), the typical pipeline construction process consists of the following steps:
- Survey/demarcate the route and approved workspace.
- Centerline survey of existing or proposed pipelines.
- Clearing – remove vegetation from construction work area (CWA); installation of erosion and sediment controls.
- Additional protection of adjacent pipeline, as necessary; grading to establish safe workspace; completion of installation of erosion and sediment controls.
- Trenching – pipeline trench excavation to design depths.
- Stringing – placement of pipe joints along the trench line.
- Bending – bending pipe joints, as needed, for route and terrain.
- Weld pipe.
- Pipe integrity – visual inspection, non-destructive examination (NDE) of welds.
- Weld coating – corrosion protection and waterproofing.
- Pipe placement – pipe placed in trench, tied to previously laid sections, backfilled.
- Hydrostatic testing – confirmation of pipeline segments.
- In-line tool inspection of new pipeline segments.
- Tie-in to existing pipeline, purge, pack new section with gas.
- Grade restore of CWA to previous contours.
- Final clean-up, restoration, and seeding.
Potential Risks of the PennEast Pipeline
Due to the enormous volume of natural gas moving through the pipeline at high pressure, there is a significant chance that the pipeline will leak. The probability of a leak or rupture also depends on the chemical composition of the gas traveling through the pipeline and how corrosive it is. Unfortunately, when pipelines fail there can be disastrous consequences (see Figure 14 and Figure 15).
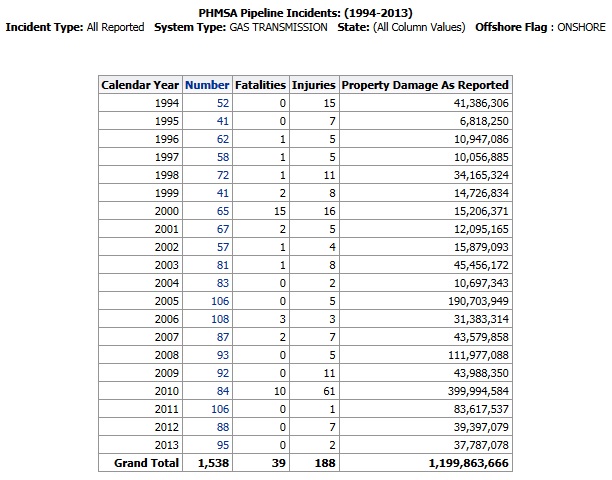

As shown in Figure 14 and Figure 15, pipeline incidents tend to be result in few fatalities and injuries, but the amount of property damage is significant. It is also important to consider the diameter of the pipeline when assessing its risk of failure. Wang and Duncan (2014) found that larger diameter pipelines pose a significantly greater risk of failure than smaller ones because the average fatality and injury rates for larger diameter pipelines are much greater than those for smaller diameter pipelines. The PennEast pipeline is planned to have a diameter of 36 inches, which is relatively large, so its risk of failure is much greater.
According to the final draft of PennEast’s Resource Report 01 (2014):
“Potential cumulative impacts may include increased sediment into nearby wetlands and waterbodies, increased traffic due to lane or road closures, impacts of businesses, noise impacts from heavy machinery and construction, decreased air quality, removal of natural trees and vegetation, spread of invasive species, impacts to wildlife and fisheries, and impact to visual resources.”
The impacted sites in Northampton County, PA are the Lehigh River Eastern Gateway Redevelopment and the Easton Waterfront Development. Based on the initial field surveys, a total of 33 wetland complexes and 60 waterbodies have been identified that may potentially be affected. These resources consist of only freshwater-influenced systems.
In general, natural gas pipelines negatively impact the environment by causing natural habitat loss and fragmentation, changes in species movement, sedimentation, and air emissions (Johnson, Gagnolet, Ralls, & Stevens, 2011). The pipeline right-of-way corridor can fragment large patches of forest into smaller ones, reducing forest interior spaces. The open space of the corridor inhibits the movement of some species, like forest interior nesting birds, tend to avoid open spaces where they are more exposed to predators (Bennett, 2003). While right-of-way corridors may inhibit the movement of some species, they can also facilitate that of others, both native and invasive (Transportation Research Board, 2004). While the exact repercussions of this effect on species movement are unclear, it is certainly an unintended consequence of pipeline construction.
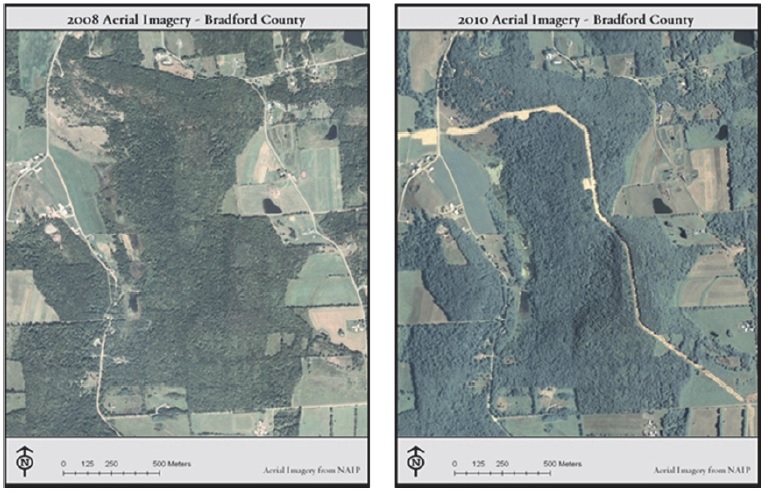
As shown in Figure 16, a swath is cut through forests and wetlands during pipeline construction. When constructing a pipeline, a large amount of soil is disturbed, increasing the risk of problems with erosion and sedimentation. This can lead to a number of negative consequences including safety concerns and surface water contamination. It can also be exacerbated by other factors, such as steep terrain, nearby bodies of surface water, and heavy rain events (Johnson et al., 2011). For example, the heavy rains during two tropical storms in August and September 2011 caused the erosion and sediment controls on pipelines under construction in north central Pennsylvania to fail (Tanfani & McCoy, 2011). According to Tanfani and McCoy (2011), this resulted in dangerous mudslides that contaminated a nearby stream.
Pipelines and compressor stations emit several pollutants into the air including methane, ethane, benzene, tolulene, xylene, carbon monoxide, ozone and more, but short-term monitoring in north central Pennsylvania detected only some of these pollutants and they were at low enough levels that they would not trigger public health concerns (DEP, 2011). However, some of these pollutants were detected near pipelines and compressor stations in the Barnett Shale region of Texas at high levels that sometimes exceeded human health standards (Armedariz, 2009). While the safety risk of air emissions from pipelines and compressor stations may not be clear, these pollutants can still have an impact on the environment at low levels.
Website
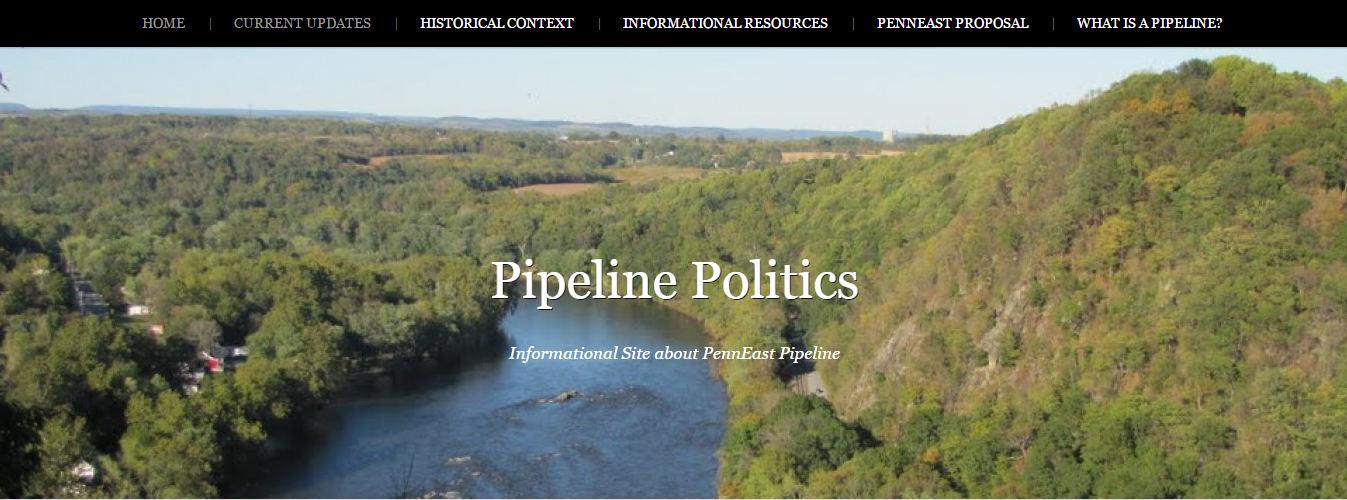
In order to educate those affected by the pipeline or interested in it, we have constructed a website to provide an easily accessible and understandable source of information on the subject. This website is a Lafayette site with an administrator account shared with the Nurture Nature Center. It will be managed by volunteers associated with the Nurture Nature Center who will ensure that it is properly maintained and updated as new developments arise with the PennEast pipeline. These updates will be crucial because the project is only in its preliminary stages and new information will be released frequently. There should be at least one update each month when PennEast submits a monthly progress report to FERC online. The homepage of the website consists of a concise introduction, conveying the purpose of the website and an overview of the PennEast pipeline project. Along the top of the webpage is a list of clearly visible tabs connecting to other pages of the website. Each tab focuses on a different dimension of the issue including the historical context with social and policy elements and information on the pipeline itself with a technical and economic analysis. Each tab provides a comprehensive explanation of a wide range of topics relevant to its context or analysis. Each tab heading page includes a brief summary of the related content and a drop-down menu linking to its subsections. This allows readers to quickly and easily locate specific topics. Additionally, the context and analysis pages contain links to fact sheets with empirical data presented through infographics. Each fact sheet is one page long and focus on a specific topic. However, there is not a fact sheet for every topic and tab because some topics cannot be explained through empirical data.