Economic analysis
Introduction to historical pipeline construction cost analysis
Most of the following research is from “Historical Pipeline Construction Cost Analysis” by Zhenhua Rui, Paul A. Metz, Doug B. Reynolds, Gang Chen, and Xiyu Zhou of the University of Alaska Fairbanks.
Pipelining is an important and economical method to transport large quantities of oil and natural gas in the petroleum industry. The first pipeline in the USA, two-inch in diameter and over 8 km long, was built in 1865. By 2008, US had a total of 793,285 km of pipelines, among which 224, 260 km was for petroleum product and 548,685 was for natural gas (Rui, 2011).”
To understand pipeline construction costs, pipeline data — such as pipeline diameters, lengths, capacity, year of completion, and location — are analyzed. The PennEast Pipeline’s dimensions are expected to be as follows:
- Diameter of 36 inches, which is 3 feet
- Length of 108 miles, which is 570,240 feet [1]
- Capacity of 4,030,789 cubic feet [2]
- Completed in year 2017
- Located in the Northeast [3]
To further understand pipeline construction costs, the following cost components cost components are analyzed:
- Material costs: the cost of line pipe, pipeline coating, and cathodic protection
- Labor: the cost of pipeline construction labor
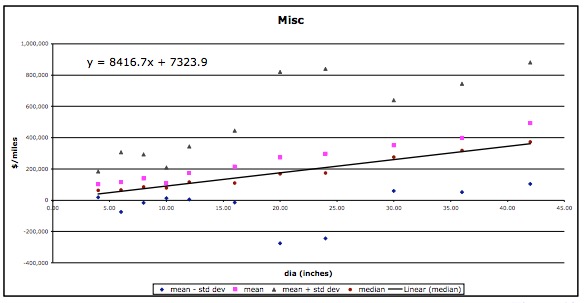
- Miscellaneous: a composite cost of surveying, engineering, supervision, contingencies, telecommunications equipment, freight, taxes, allowances for funds used during construction, administration and overhead, and regulatory fees
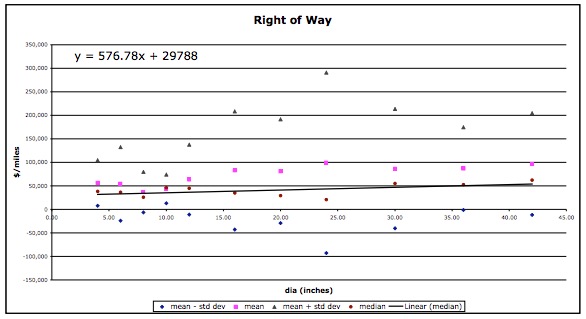
- Right of Way (ROW): the cost of ROW and allowances for damages
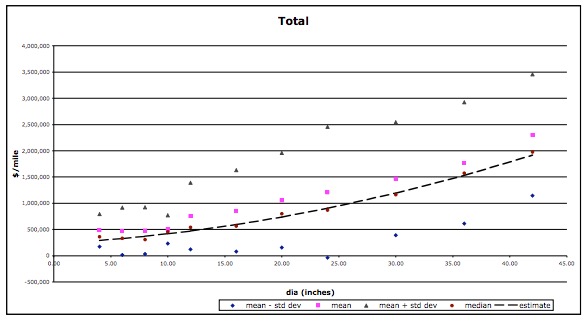
- Total: the sum of material, labor, miscellaneous, and ROW costs
Distribution and share data
In this section, PennEast Pipeline distribution, share and cost data has been compared to those of 412 pipelines recorded between 1992 and 2008 in the Oil and Gas [4].
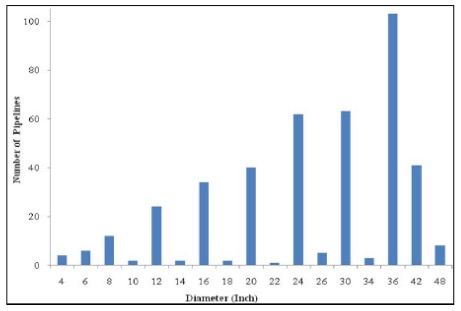
Diameter
Diameters of the 412 pipelines recorded between 1992 and 2008 range from 4 inches to 48 inches and value of diameters is even. From low values to high, data shows that values of pipeline diameter are left-skewed. For example, there are only 24 (5.8% of the total) pipelines with diameters between 4 inches and 10 inches, while 218 (52.9% of the total) pipelines with diameter between 30-inch and 48-inch, like the 36-inch PennEast Pipeline. Data being left-skewed indicates that more larger-diameter pipelines have been constructed than smaller-diameter pipelines in the last two-decades. At 36 inches, PennEast Pipeline would be a larger-diameter pipeline, which is more common.
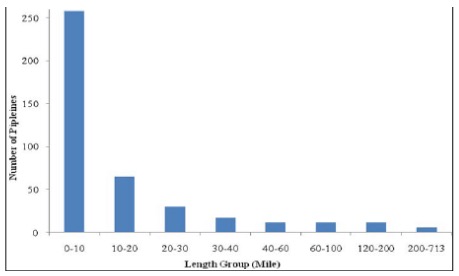
Length
Lengths of the 412 pipelines recorded between 1992 and 2008 range from 0.01 miles to 713 miles. The distribution is right-skewed. From low to high, data shows that values of pipeline lengths are right-skewed. For example, there are 258 (62.6% of the total) pipelines in the 0 to 10 mile group, and 65 pipelines in the 10 to 20 mile group, but on 30 (7.3% of the total) of pipelines are longer than 60 miles, like the 108-mile PennEast Pipeline. Data being right-skewed indicates that the majority of reported pipelines are shorter pipelines. At 108 miles, PennEast Pipeline would be longer, which is less common.
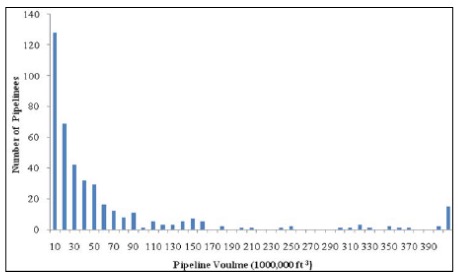
Capacity
Capacities of the 412 pipelines recorded between 1992 and 2008 range from 13,270 cubic feet to 5,215,691,727 cubic feet. Capacities range from 13,270 cubic feet to 5,215,691,727 cubic feet, and the average pipeline capacity is 86,511,969 cubic feet with standard deviation of 15,840,088 cubic feet. The distribution of pipeline capacity is right-skewed. For example, there are 59.29% of pipelines’ capacities less than 30,000,000 cubic feet, and only 3.64 of pipelines’ capacities larger than 400,000,000 cubic feet. At 4,030,789 cubic feet, PennEast pipeline would be smaller, which is more common.
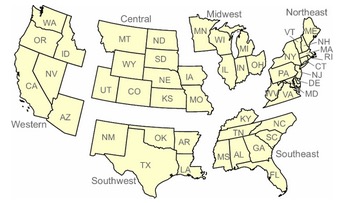
Location
There are 157 pipelines located in the Northeast region, which is 40% of US pipelines for the region with the greatest number of pipelines. In the Northeast, Pennsylvania is the state with the most pipelines at 72.5, which is 17.60% of US pipelines and 46.18% of Northeast pipelines. The fewest number of pipelines was located in the Southwest region, which had 30 pipelines, 7.5% of US pipelines. The number of pipelines in other regions is between 48. As stated earlier, PennEast Pipeline is located in the Northeast region, in the state of Pennsylvania, which is the most common location for a pipeline.
Unit cost data [5]
Generally, labor and material cost dominate the pipeline cost. Labor cost has the highest share of 40% of total cost. Material has the second highest share of 31% of total cost.
Material
For all 412 pipelines, material cost on average is second highest. The average unit cost in material was $18 per cubic feet, 31% of total average unit cost. This cost tended to change more gradually and was more stable compared to other components.
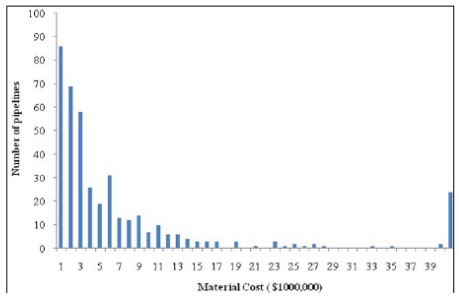
PennEast Pipeline would be located in the Northeast region. With a diameter of 36 inches, a length of 108 miles, and a location in the NorthEast, the diameter of PennEast Pipeline is in the range of 34 to 48 inches, and the length is in the range of 60 to 160 miles. For pipelines located in the Northeast, material costs tend to be 24% of total. In addition, for pipelines in the mentioned ranges of diameter and length,material costs tend to be 34% and 31%, respectively. Therefore, in terms of its location, diameter, and length, the material cost of PennEast Pipeline would be between 24% and 34% of its total construction cost.
Regarding material cost trends, values of length and diameter that are higher tend to be associated with higher material cost percentages. To reiterate, PennEast Pipeline would be a larger in terms of diameter and length, meaning material cost percentages would be higher. On the other hand, the Northeast region is associated with the lowest material unit cost percentage, and PennEast Pipeline would be located in the Northeast.
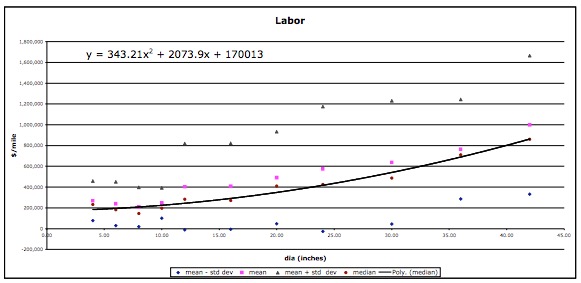
Labor
For all 412 pipelines, labor cost on average is highest. The average unit cost in labor was $24 per cubic feet, 40% of total average unit cost. This cost tended to fluctuate widely with miscellaneous cost.
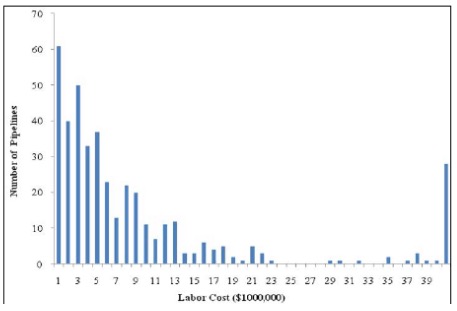
Given the 3 groups in terms of diameter, length, and location, associated with the PennEast Pipeline, associated labor cost percentages are 40%, 39%, and 43%. This means labor costs for PennEast Pipeline would range from 39% to 43% of total pipeline construction cost. As the length of pipelines increase in construction, labor cost percentages tend to decrease. The Northeast, where the PennEast Pipeline would be constructed, is associated with the highest labor cost.
Miscellaneous
For all 412 pipelines, miscellaneous cost is second lowest. The average unit cost in miscellaneous was $14 per cubic feet, 23% of total average unit cost. This cost tended to fluctuate widely with labor cost.
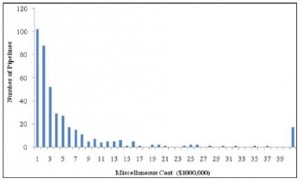
Given the 3 groups in terms of diameter, length, and location, associated with the PennEast Pipeline, associated miscellaneous cost percentages are 20%, 23%, and 27%. This means the labor cost of the PennEast Pipeline would be between 20% and 27% of total pipeline construction cost. As the diameter or length of pipelines increase in construction, miscellaneous cost percentages tend to decrease. The Northeast, where the PennEast Pipeline would be constructed, is associated with the second highest labor cost.
ROW
For all 412 pipelines, ROW cost is lowest. The average unit cost in ROW was $5 per cubic feet, 7% of total average unit cost. This cost tended to change more gradually and were more stable compared to other components.
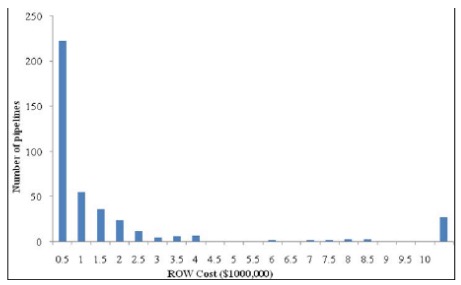
Given the 3 groups associated with the PennEast Pipeline in terms of diameter, length, and region, ROW cost percentages for are 6%, 7%, and 6%. Labor cost percentages tended to decrease by diameter, and the Northeast had a relatively typical ROW cost.
Average unit cost trends over time
Before 1998
All cost components changed slowly before 1998, similar to the change in constructed pipeline volume.
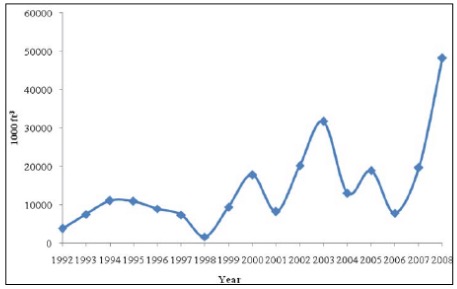
After 1998
After 1998, the change was dramatic. The years of 1999, 2002, and 2007 were the three-major peak years in unit total cost. The highest unit total cost was reached $109 per cubic foot in 1999, which was almost three-times as high as the bottom point of $39 per cubic foot in 1998
These three-peak years in unit total cost occurred all one year before the peak years in constructed volume. This evidence indicates that expectation of increased pipeline construction induced an increase in the current unit cost.
Material suppliers would raise prices with expectation for more demand the next year. The higher expected demand in labor would cause labor shortage, and the competitive salary and benefits had to be paid in order to hire or keep more skilled laborers. Miscellaneous cost also increased due to more demand
All these factors together resulted in high cost one year before the peak year in constructed pipeline volume.
Estimating PennEast Pipeline cost components
Using unit cost of components and pipeline length
As previously stated, unit costs in material, labor, miscellaneous, and ROW are on $18, $24, $14, and $5 per cubic foot. Using the length of the PennEast Pipeline, the following cost components can be calculated in 2008 dollars:
- Material cost of $10,264,320
- Labor cost of $13,685,760
- Miscellaneous cost of $7,983,360
- ROW cost of $2,851,640
- Total cost of $34,784,640
Using cost percentage of components and estimated total pipeline cost
As previous stated, average percentages in material, labor, miscellaneous, and ROW are 31%, 41%, 23%, and 7%. Using the $1-billion estimated total cost of the PennEast Pipeline, the following cost components can be calculated:
- Material cost of $295,081,967.21
- Labor cost of $393,442,622.95
- Miscellaneous cost of $229,508,196.72
- ROW cost of $81,967,213.11
- Total cost of $1,000,000,000.00
Using component cost equations and plots from another study
Using “Natural Gas Transmission Pipe Costs to Estimate Hydrogen Pipeline Costs” by Nathan Park of the University of California at Davis Institute of Transportation Studies, construction costs of natural gas, oil, and petroleum product transmission pipelines were analyzed. It provided equations and plots to estimate PennEast Pipeline cost components according to its length and diameter.
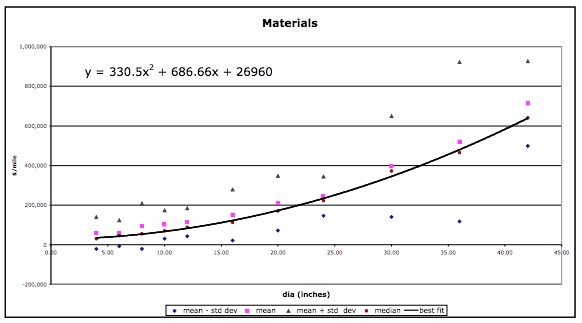
According to equations:
- Material cost of $51,877,160
- Labor cost of $74,619,140
- Miscellaneous cost of $33,611,288
- ROW cost of $83,987,847
- Summed total cost of $244,095,435
- Total cost of $165,724,164
According to plots:
- Material cost of $41,000,000
- Labor cost of $50,000,000
- Miscellaneous cost of $20,000,000
- ROW cost of $5,000,000
- Summed total cost of $116,000,000
- Total cost of $165,000,000
The Takeaway in Estimating PennEast Pipeline cost components
Four methods were used to estimate the construction cost of PennEast Pipeline according to cost components like material, labor, miscellaneous, and ROW, as well as total cost. The cost components varied widely. What is more, summed amounts of estimates for a study tended not to equal estimated total amounts.
The takeaway is this: cost estimation is complex. Many factors need to be taken into consideration, more than pipeline diameter, length, capacity, location, and time. Using only these factors might be the reason why cost estimates varied so widely. Hence, the research on this page supposes that cost estimations should be taken as what they are: estimates. Time shall tell the actual cost of pipeline construction if the pipeline is constructed as planned.
Gas Prices
The General Project Description of a PennEast Resource Report indicates the following public problem:
The lack of a new pipeline with access to sources in Pennsylvania will continue to create dramatic seasonal price fluctuations in Pennsylvania and New Jersey with higher gas and electric rates and an increased potential for energy shortages during peak demand, resulting in threats to business continuity, public safety, and national security.”
To understand this problem better, please view the chart below, which is provided by PennEast:
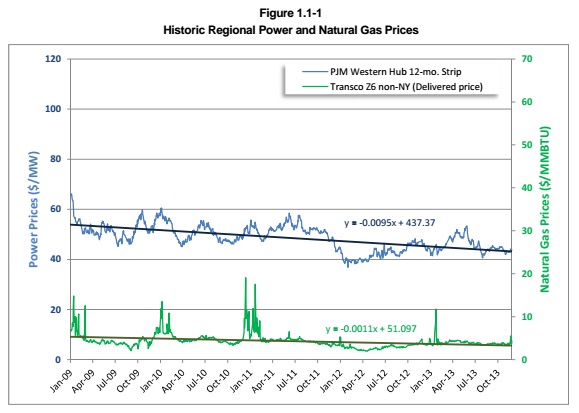
The blue is PJM Western Hub prices, which we believe represents aggregate energy prices. The green line is TRANSCO National Gas Line prices, which we believe is supposed to be likened to potential gas prices that would result following PennEast Pipeline Construction. That is, because the green line is below the blue line, natural gas prices would fall. Estimates provided by PennEast state constructing the Pipeline would decrease natural gas prices from $100 per dekatherm to $3 or $4 per dekatherm.
Both lines show decreasing slopes, meaning the prices of energy and natural gas, respectively, will decrease over time. The blue line tends to peak cyclically in summertime and winter, which would make sense because of increased demand for heating and cooling. The green line tends to peak during the winter, which would make sense because of increased demand for heating. These peaks would be what PennEast referred to in their literature.
According to a announcement from PennEast,natural gas prices in New Jersey traded as high as $100 per dekatherm this past winter. Natural gas in the area that PennEast will access traded in the range of $3 to $4 per dekatherm. The proposed pipeline will help reduce this price volatility to the benefit of New Jersey’s nearly 3 million gas consumers. Still, PennEast reports:
The Project will provide additional opportunities to buy and sell supplies and to transport natural gas to where it is needed and valued most.”
Citizens who support the pipeline might be interest in lowered gas rates. In addition, Pipeline Construction is expected to produce 2000 temporary jobs during the construction process, which is expected to last between 7 months and one year. Moreover, Pipeline Construction might produce externalities like industrial and economic development in the region.
According to our research, the problem stated by PennEast, which is closely tied to economic growth, must also consider environmental health and societal acceptability to rise to prominence and be compatible with environmental systems and social goals.
Next
Next is the Conclusion.
Footnotes
[1] Pipeline length was converted from miles to feet such that 1 mile is 5280 feet
[2] Pipeline Capacity was calculated using the equations V = S*L and S = pi*(D/2)^2 where:
- V is pipeline capacity or volume in cubic feet
- S is pipeline cross-sectional area square feet
- L is pipeline length in feet
- Pi is approximated to be 3.1415926535
- D is pipeline diameter in feet
[3] Energy Information Administration (EIA) breaks down the USA natural gas pipelines network into six regions: Northeast, Southeast, Midwest, Southwest, Central, and Western. Northeast consists of states from as far south as Virginia to as far north as Maine.
[4] Cost data collected was adjusted to 2008 dollars with the chemical engineering plant cost index (CEPCI) – a widely used index for adjust process plants’ construction cost to 2008 dollars. Pipe index and construction labor index of CEPCI are used to adjust pipeline material and labor costs. CE index is applied to pipeline miscellaneous and ROW costs.
[5] The unit component costs of pipeline are an important parameter for estimating pipeline costs. Unit cost is calculated by dividing cost by volume.
[6] Considered diameter ranges include 4-20 inches, 22-30 inches, and 34-48 inches; length ranges include 0-60 miles, 60-160 miles, 160-713 miles; regions include all six, which excludes Alaska and Hawaii.