Ask your instructor or lab professor how to download MestraNova.
You should receive one of the following file formats from your instructor:
filename.jdx
filename.nmr
filename.bin
filename.spc
Follow the directions below to process the data given to you.
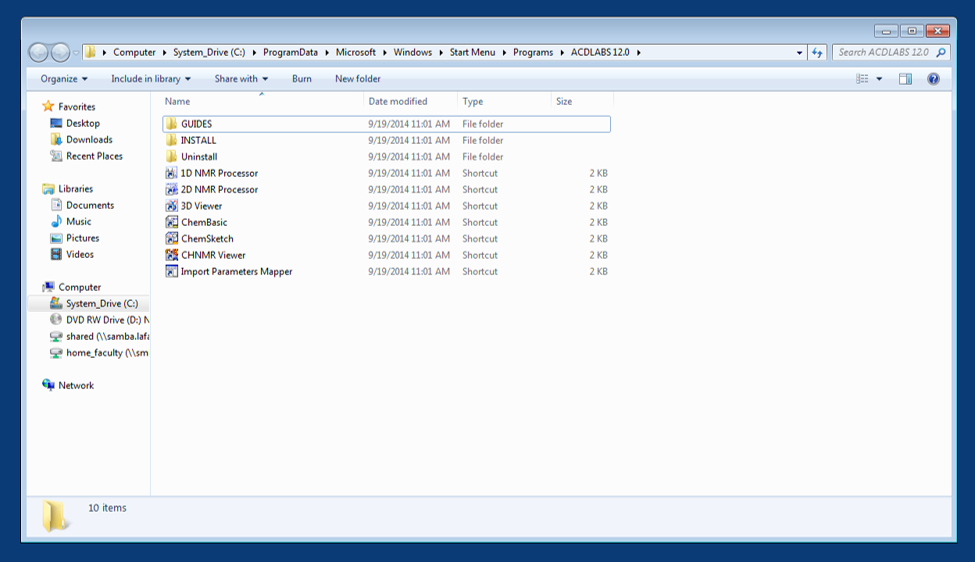 |
1. Open the MestraNova folder on your computer.It should appear as it does to the left.2. Open the 1D NMR processor. You can open files from the opening dialog box (right), from FILES in the top left tool bar, or by pressing the red folder with a blue arrow on the toolbar. | 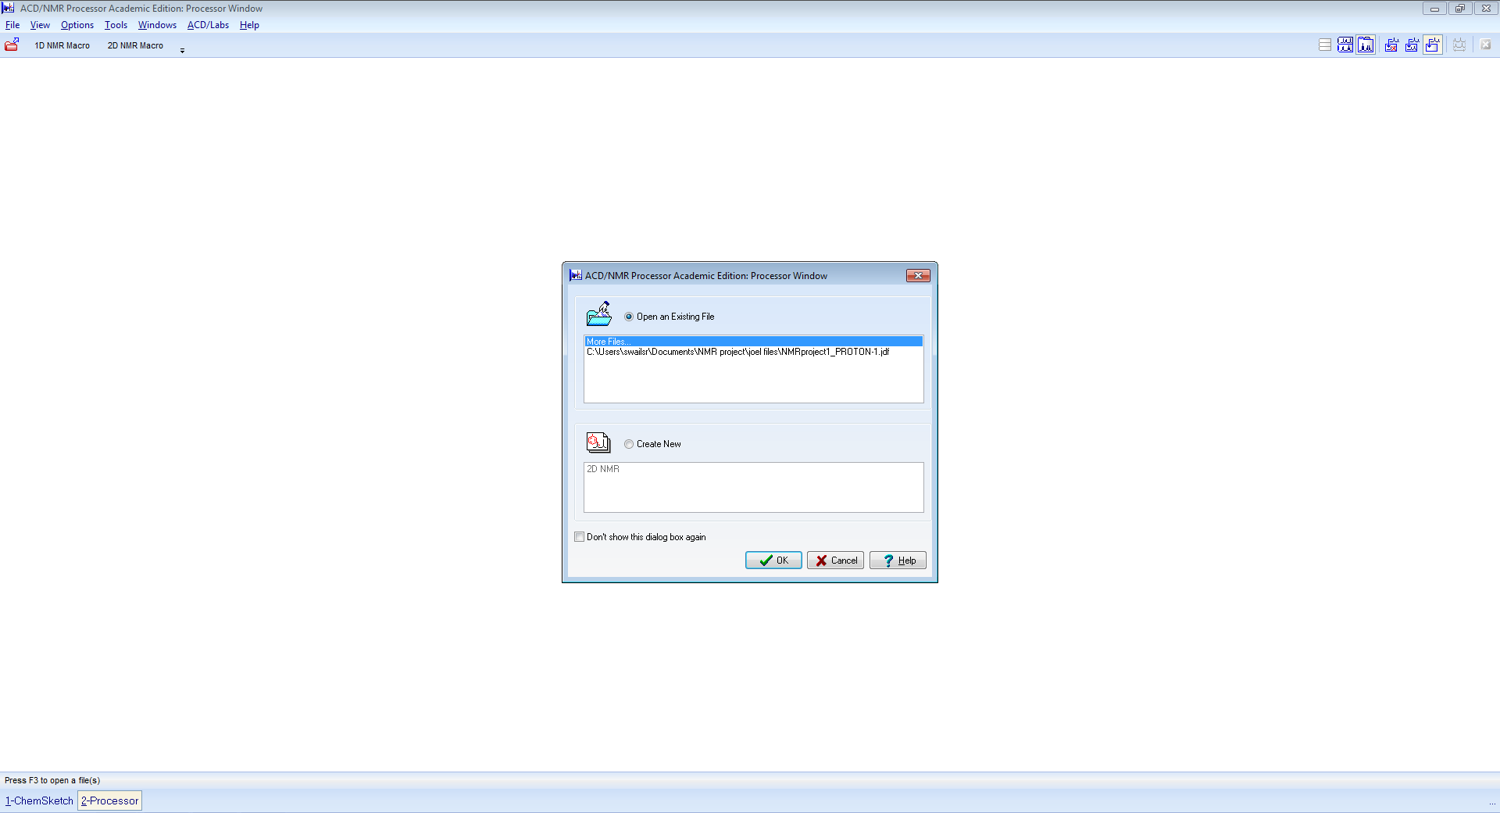 |
 |
3. Processing an FIDIf your data appears as an FID (left) it will need to be transformed into a spectrum via FT. The FID will appear as shown to the left with the x-axis labeled “time” and the y-axis “intensity”.To process this data you can press “Fourier Tr.” on the tool bar or select PROCESS then “Fourier Transform” and click “Default Transform”. |
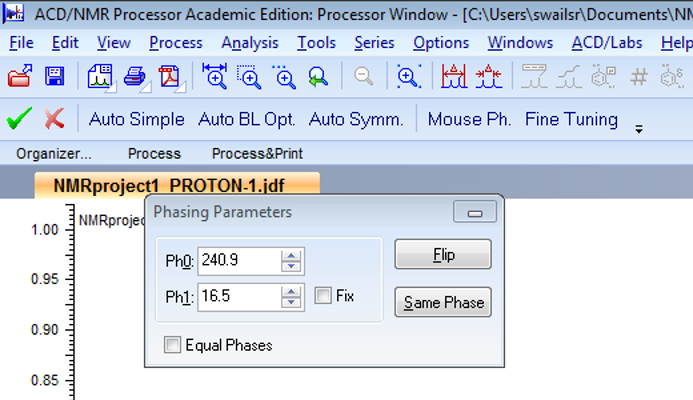 |
4. Phase Spectrum: If the baseline is not straight you may need to phase your spectrum. To enter the phase mode you will need to select “Phase” on the tool bar or select “Process” again followed by “Enter Mode” under “Phase correction”. The simplest way to phase is select “Auto Simple” in the Phase toolbar that appears. |
Once you are familiar with the program you should feel free to play with the other types of phase options. If you do not like the results you can undo any phasing by pressing the red X to the left of the phase toolbar. Once you have phased your spectra you should select the green check-mark to make those changes permanent. Please note you can always start over by exiting out of the spectrum and reopening it.
Your spectrum should look similar to the one below. Note the straight baseline.
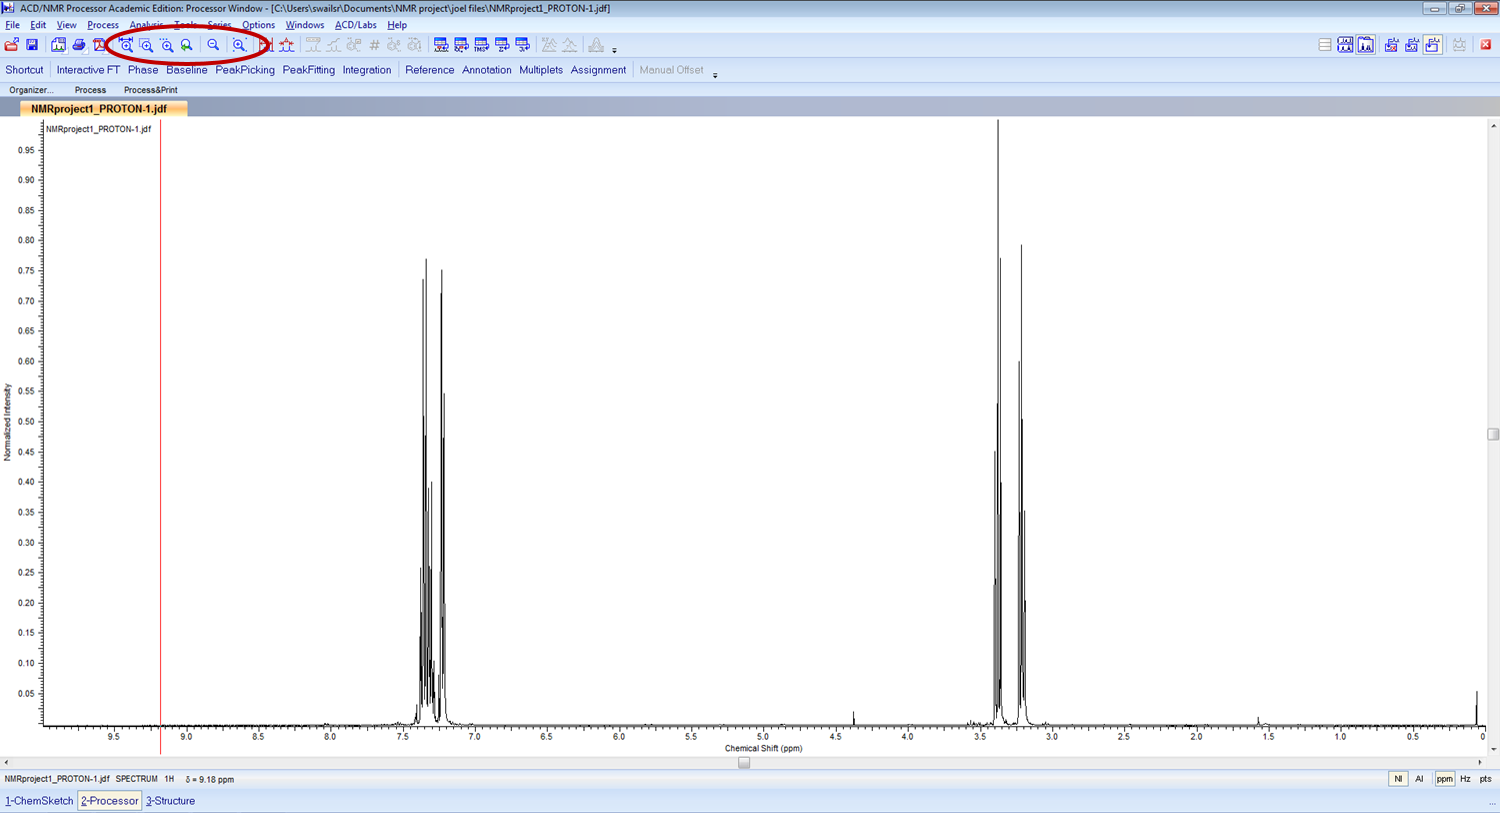
You may need to use one of the zoom functions (circled in red above) throughout the next several steps. There are several ways to zoom in and out on your spectrum and you should experiment with which you like best.
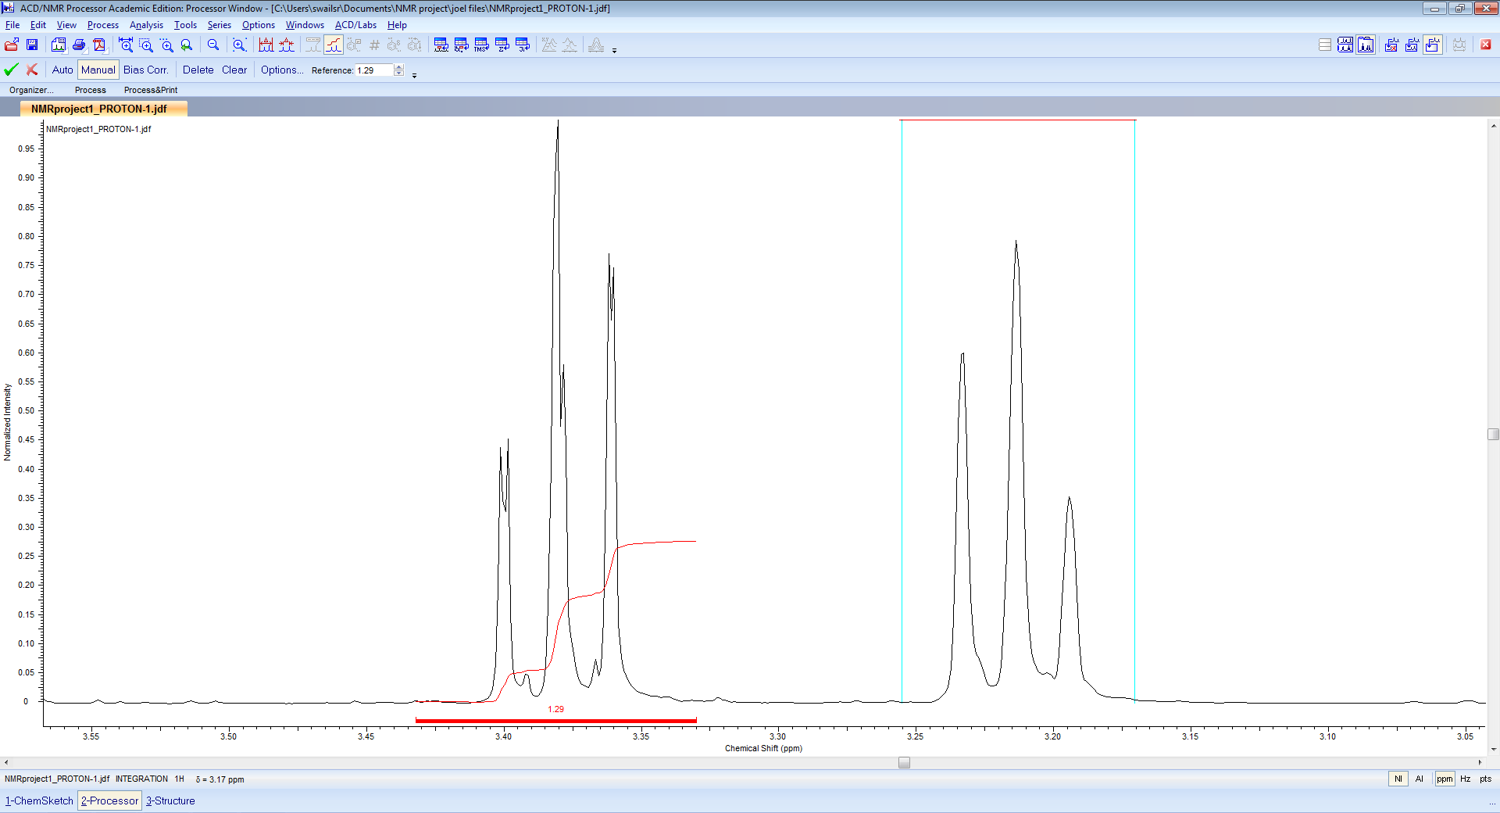 |
5. Integrating peaks: to enter the integration mode you can select “Integration” on the toolbar or select “Analysis” followed by “enter mode” under “Integration”.Always use manual integration as automatic integration does not produce accurate values for most spectra. |
Each group of peaks should be zoomed in on prior to integration. After selecting manual integration you should see a small picture flanking your mouse when you hover over any part of the screen. The picture is a graph with an I and an integral in it. If this is present you can integrate each resonance by clicking and dragging from one side of the resonance to the other (left to right or right to left). During this process the red horizontal line should change to blue as it appears on the resonance to the right in the spectrum above. Once you let up the mouse button, the selected area will be integrated as the resonance is on the left.
Reference: To set the selected integral to a specific number you can change the value of the “reference”. This value can be changed directly on the Integration toolbar or by selecting “options” on the integral toolbar and changing the “value” under selected integrals.
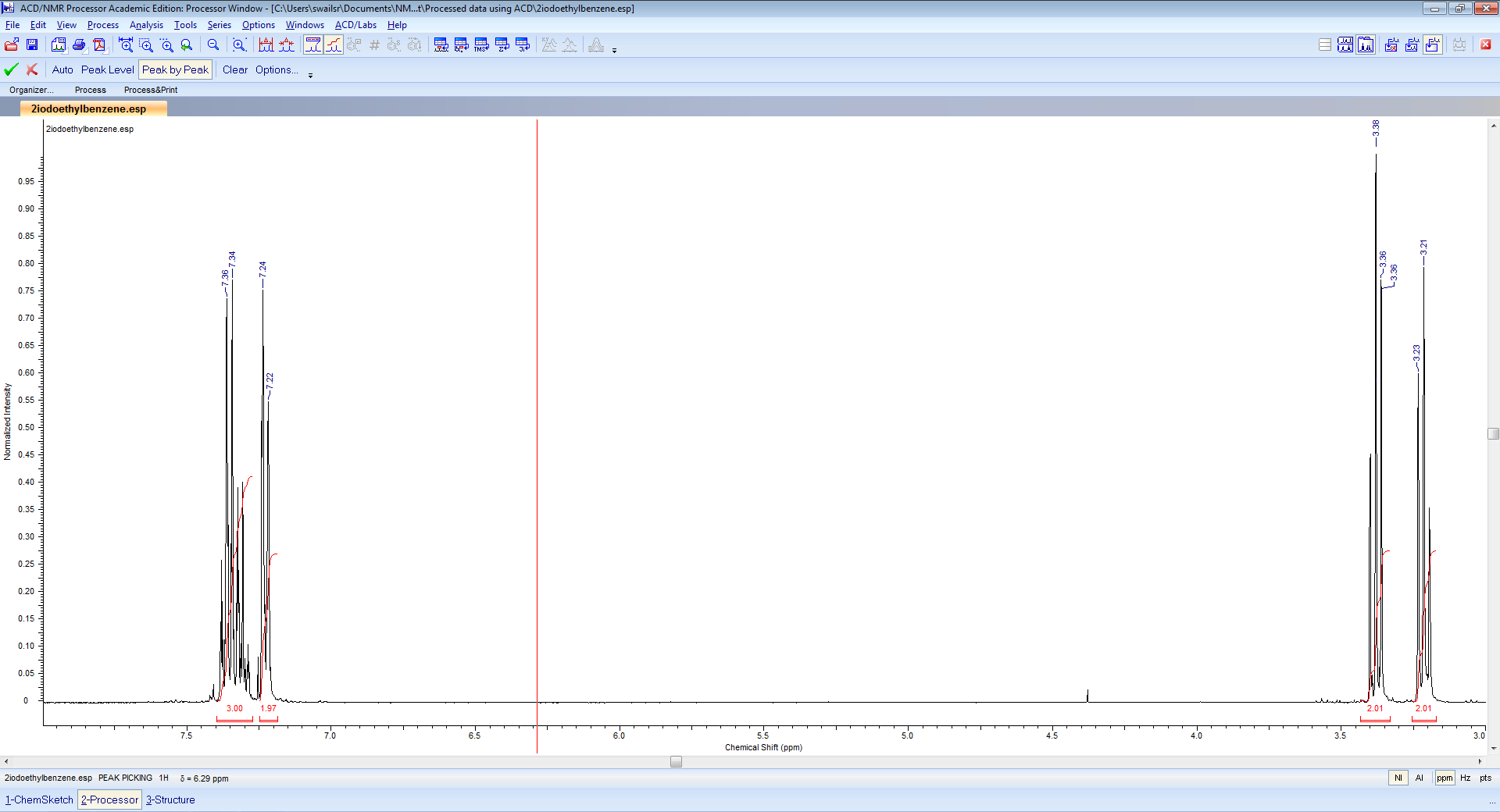
The following spectrum shows a fully integrated spectrum.
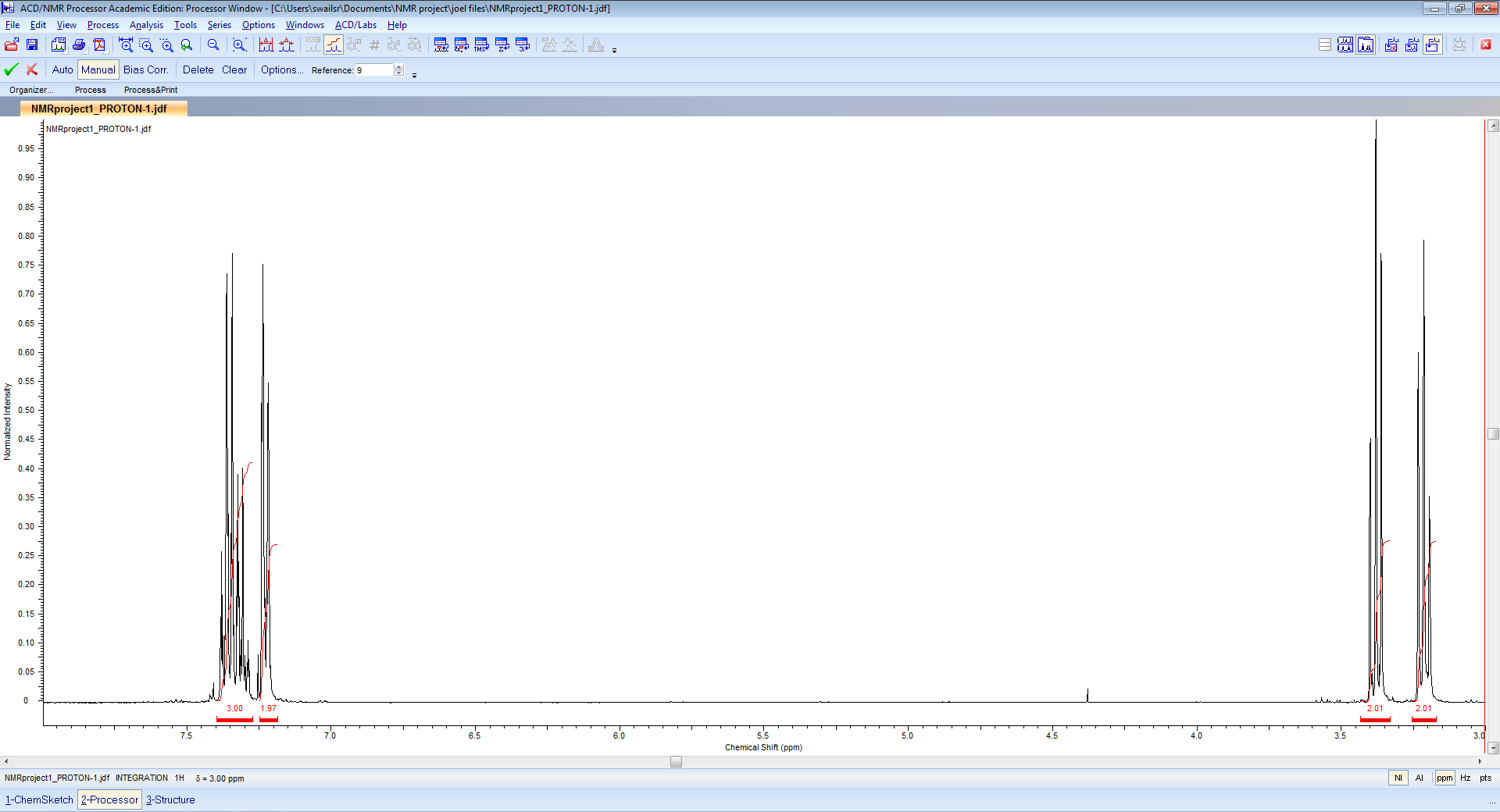 Note: to make the integrations permanent you must click the green check-mark on the toolbar.
Peak picking: For most analyses the general location of each peak is sufficient. However, using this program you can indicate the location of each single peak.
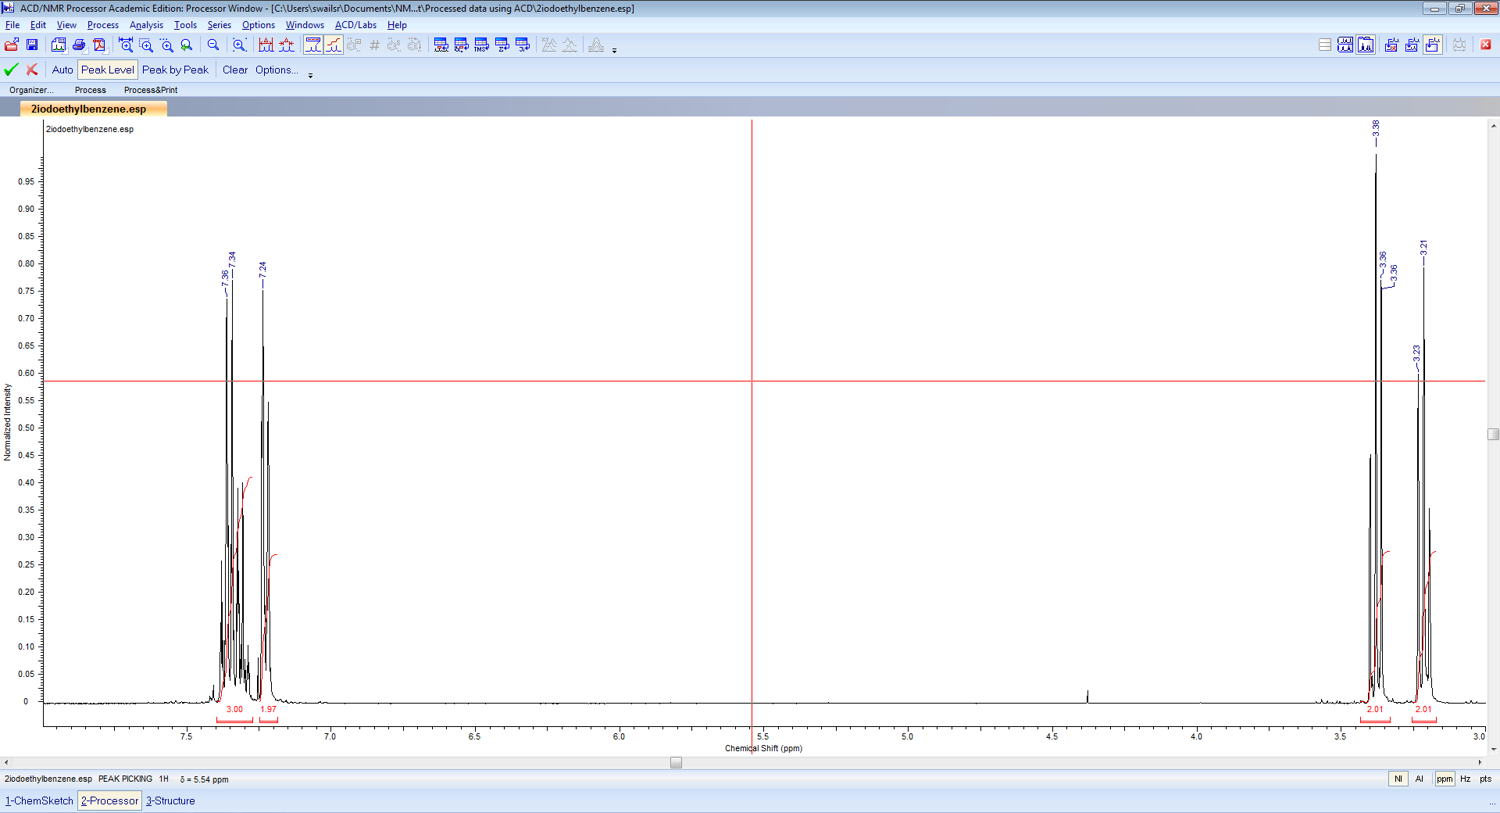 |
To enter the peak picking mode select “peakpicking” from the toolbar or select ANALYSIS and then “enter mode” under “peak picking”.”Auto” peak picking is useful if you want to see the location of each and every peak in the spectrum.”Peak level” will display the ppm location of any peak above a selected level. If selected you will see a horizontal line appear when your mouse is hovering over any region of the spectrum. If you left click, a peak location will appear for any peak with an intensity higher than the selected area. |
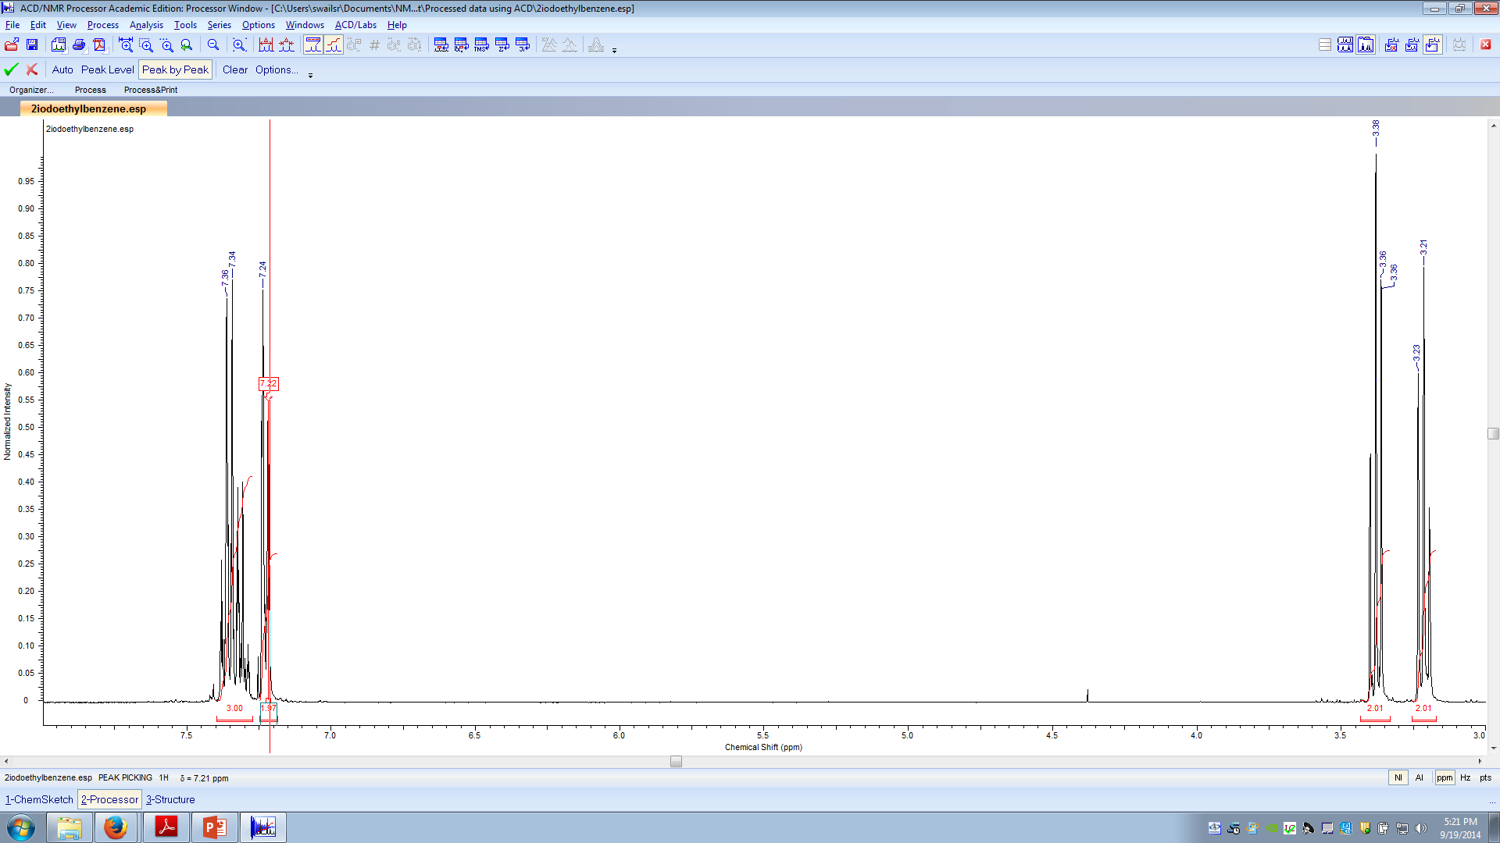 |
“peak by peak” is used to select individual peaks. Select “peak by peak” on the toolbar and then hover over the peak you desire to label. The designated peak will have a red peak label appear over it as you hover over it (left). |
 |
To make that peak label part of the spectrum you must left click. A permanent peak label will appear above the designated peak (left). |
Note: you must select the green check-mark to make the peak labels a permanent addition to your spectrum.