Each peak of an NMR spectrum will be integrated by the computer to determine the area under the peak curve. The area under the curve represents the number of protons that correspond to that resonance frequency. Therefore, integration is an INCREDIBLY USEFUL tool used to determine the number of each type of proton in a sample. You should ALWAYS consider integration before determining the structure represented by a spectrum.
The integral values are often given to you above or below each peak. In a real spectrum these values are generated electronically and represented by a curved line over the peak area.
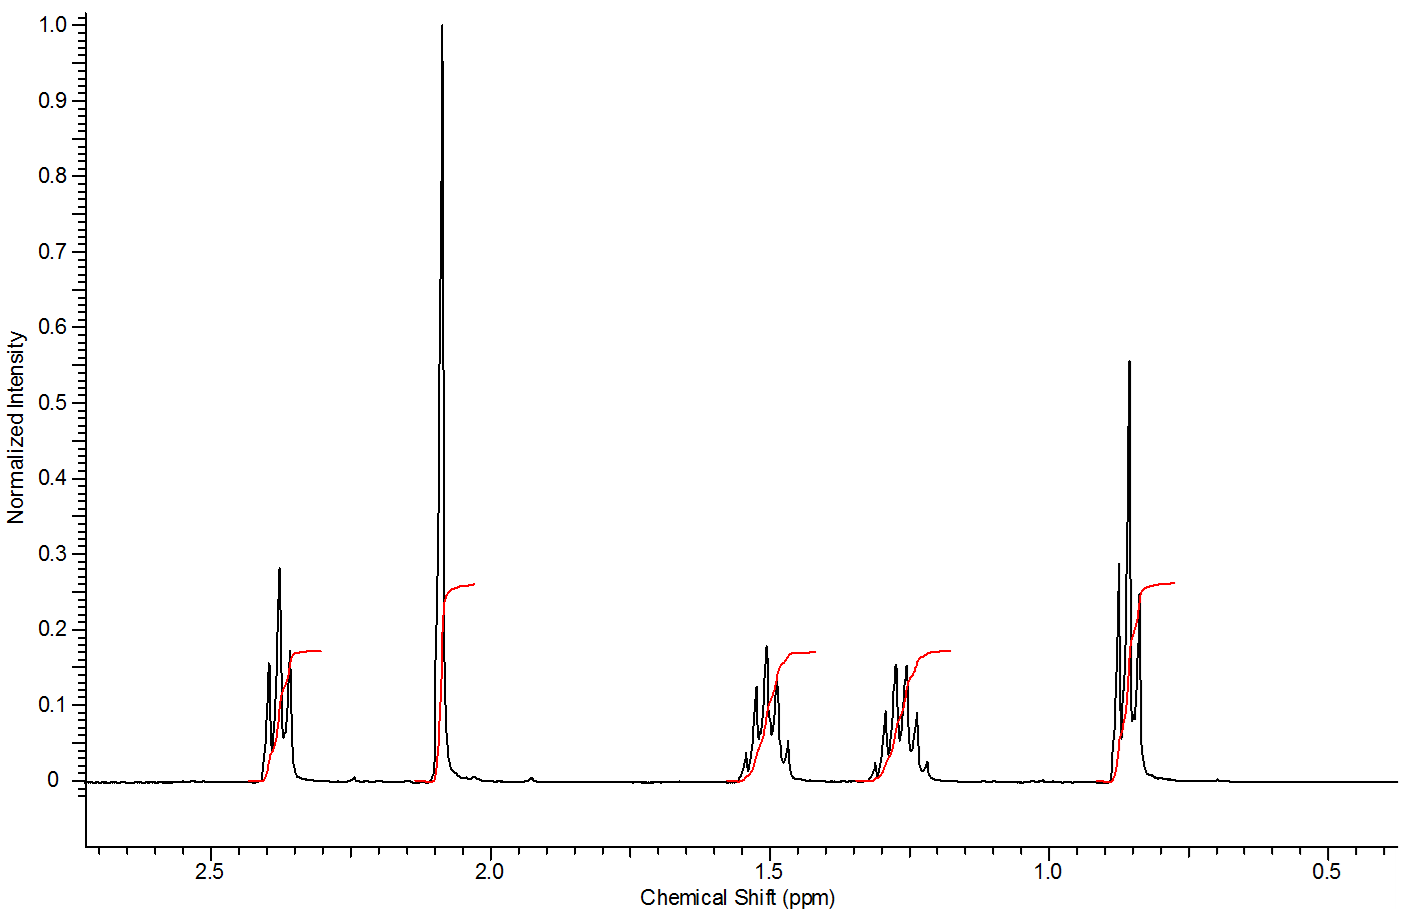 |
The height of the s-shaped red line (left) is proportional to the area under each curve. If the integral value was not given, the relative integration of each peak could be obtained using a ruler to measure the height of each integral line. |
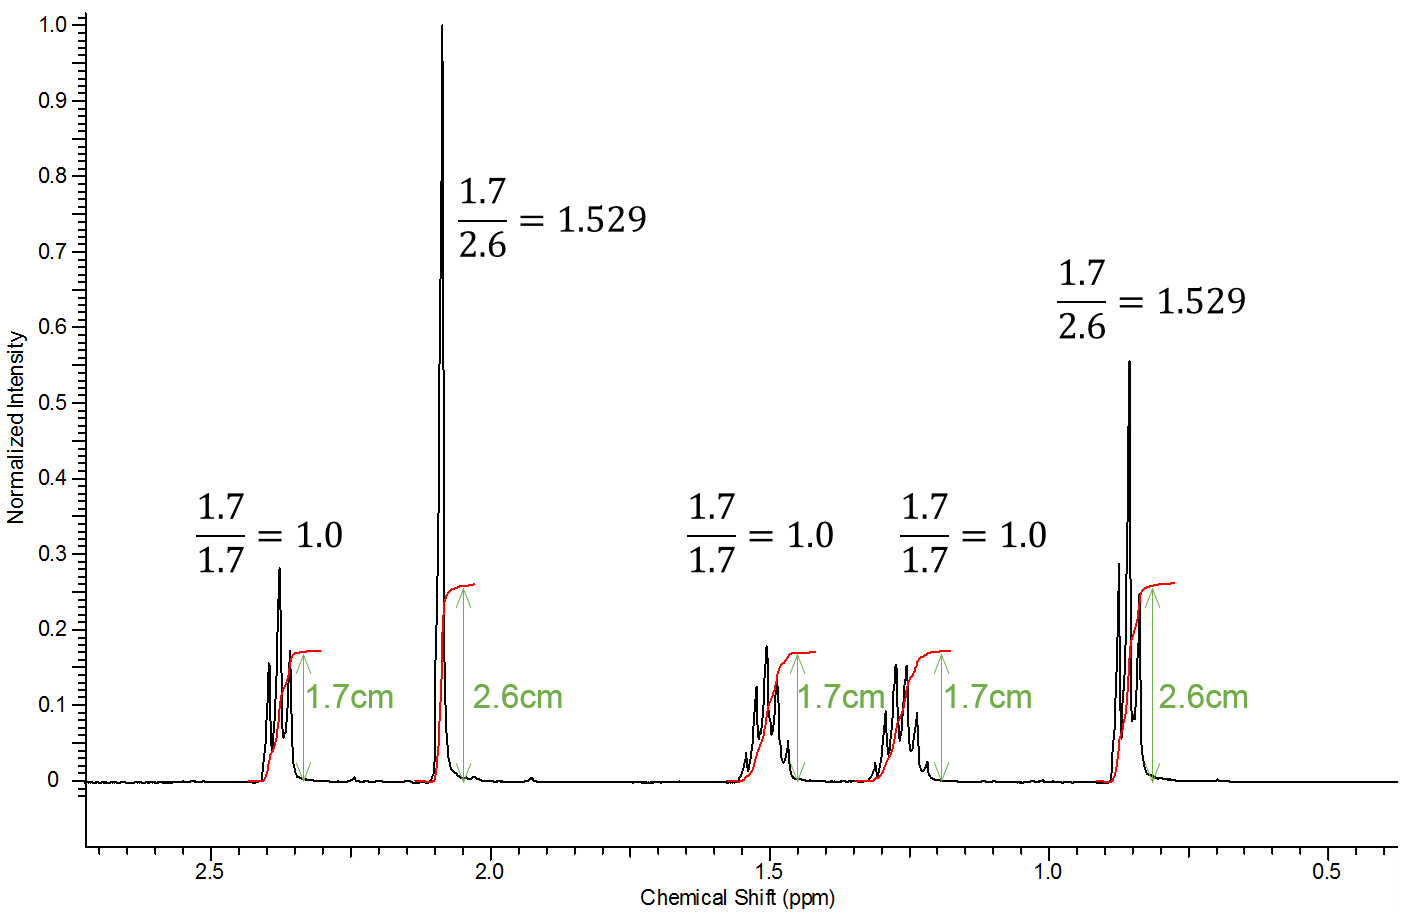 |
By dividing each integral value by the smallest value we can determine the relative integral values for each peak. Here we see a relationship of 1 : 1.5 : 1 : 1 : 1.5. Please note this does not mean that the larger peaks represent 1.5 protons. This is the relative relationship between the # of each type of proton in the molecule. The minimum real relationship between the protons is 2 : 3 : 2 : 2 : 3 which involves the same relative ratio as determined from measuring the integral curves. If the molecule in question contained 12 protons then the actual ratio would also be equal to 2 : 3 : 2 : 2 : 3. |
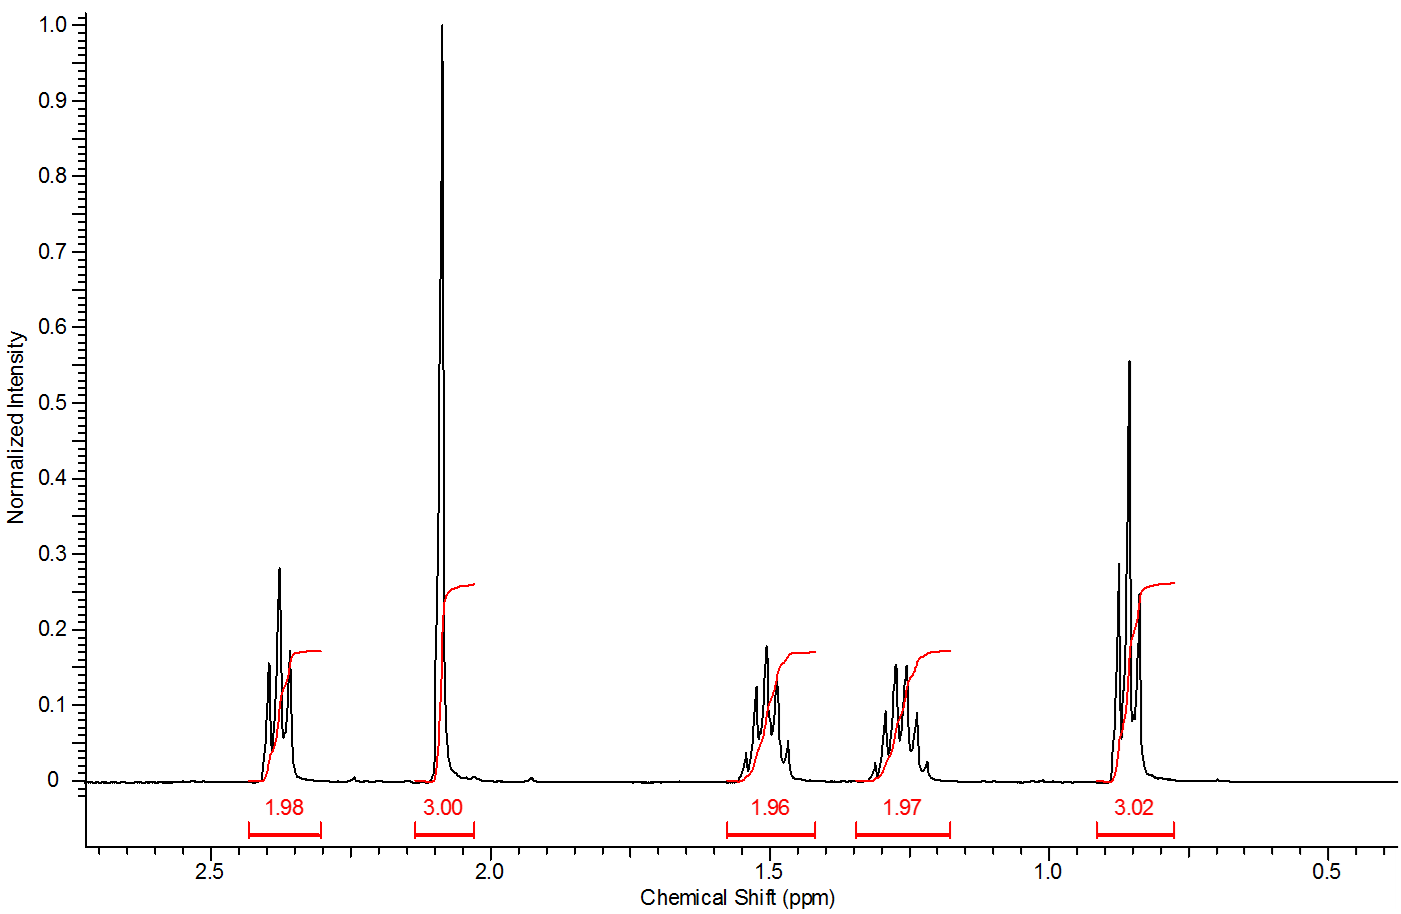 |
The experimental integral values are shown to the left. Notice only one of the integrals is a whole number. Experimental integral values are always associated with some error (up to 10%) therefore rounding an integral within ~0.1 to the nearest whole number is usually acceptable. Note that in many cases, like above, you will need to multiply by an integer to get all of the relative integration ratios close to a whole number. |

1H NMR of n-propane
Integration values are relative. This means a spectrum of n-propane (above) could be integrated in several different ways. The two terminal methyl (CH3) groups (protons labeled B) are chemically equivalent showing one triplet peak with an absolute integration of six; whereas, the internal methylene (CH2) group (protons labeled A) would appear as a quadruplet with absolute integration of two. Since integration values are relative we could designate the integration values of CH3:CH2 as 6:2, 3:1, 1.5:0.5, 4:1.333, 24:8, etc. The relative relationship will be consistent but the numerical values do not necessarily represent the true number of methyl and methylene protons contained within the molecule.
To this point we have only discussed spectra that contain a single compound. Integration can also be used to determine the relative amount of each substance in a mixture. The method used is explained on the “determining amounts in a mixture” page. You should review chemical shifts and multiplicity analysis prior to attempting this type of problem.