CHEMICAL SHIFT
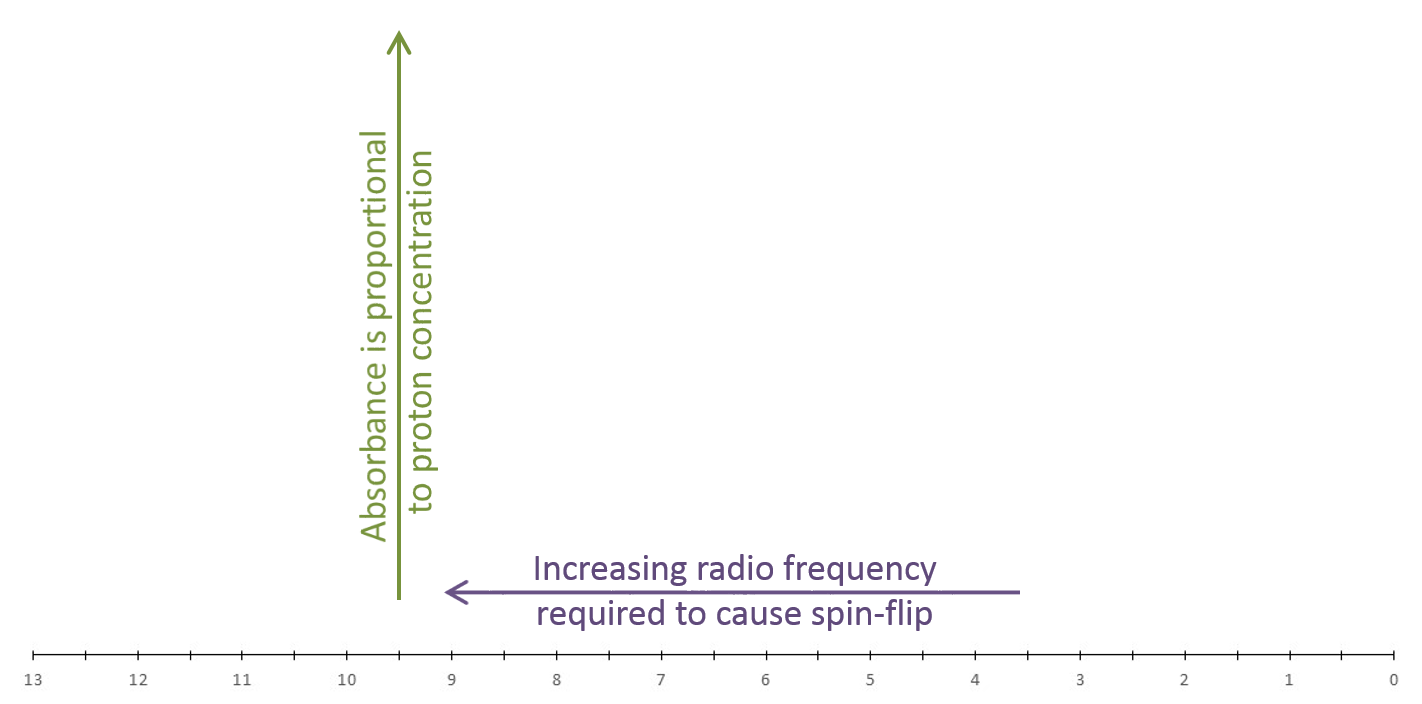 |
An NMR spectrum is a plot of radio frequency applied versus absorption. The chemical shift of a proton is the location (frequency) of its resonance on the x-axis. |
Theory:
We will refer to only proton chemical shifts in this section. However, the theory can be applied to other nuclei studied using NMR.
Protons within a molecule exist in a variety of electronic and magnetic environments. Each chemically non-equivalent proton exists in a unique electronic environment. When a strong magnetic field is applied to a sample, the electrons about each nuclei circulate, generating a magnetic field that is opposed to the applied magnetic field. This phenomenon is referred to as shielding because these nuclei are protected from the influence of the applied magnetic field. Protons surrounded by relatively large electron densities do not experience the full strength of the applied magnetic field therefore the energy required to spin-flip is much less than required for protons with very little electron density. Each group of chemically non-equivalent protons will resonate at unique energy levels.
Shielded protons will appear on a spectrum to the right of less shielded protons (correlation chart). For a general spectrum in which TMS is referenced to zero, the right side of the spectrum is referred to as upfield (higher magnetic field strength). Any proton that is less shielded than TMS will appear downfield (lower magnetic field strength/higher ppm) of zero ppm.
Chemical shift values decrease (right/upfield) with increasing magnetic field strength. Likewise, chemical shift values increase (left/downfield) with increasing resonance frequency.
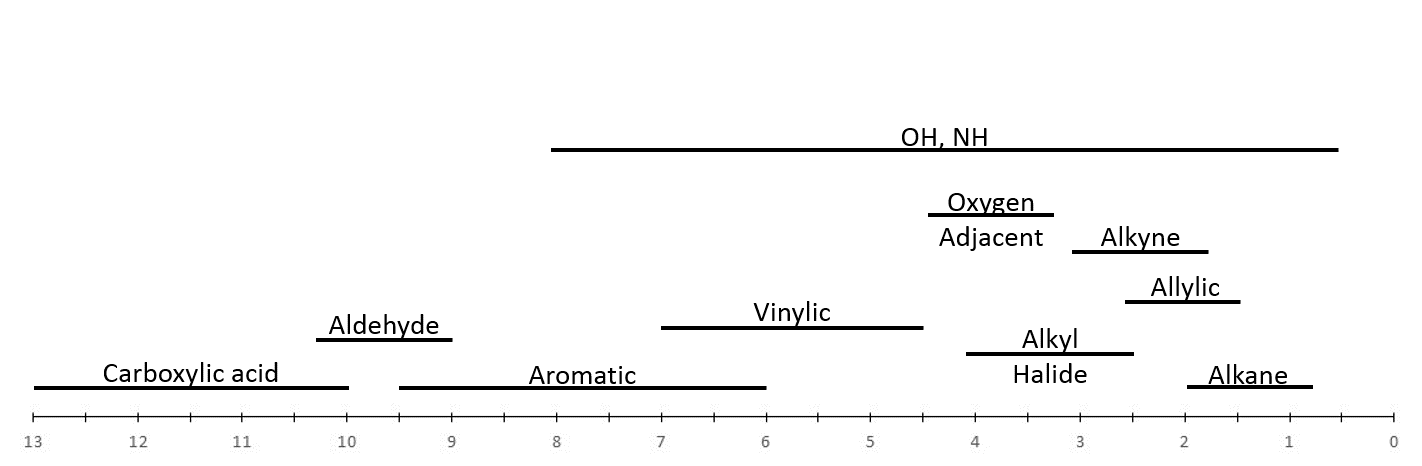
Under the practice section you will find correlation charts describing the regions that protons in particular chemical environments are typically found.
Factors affecting location of resonance peak:
For all of the following trends, the farther away (number of bonds) a proton is, the less its chemical shift is affected.
1. Electronegativity effects
2. Hybridization effects
3. Exchangeable protons and hydrogen bonding
4. Magnetic anisotropy
Electronegativity : The chemical shift of a proton will be shifted downfield if it is attached to a carbon that also contains an electronegative substituent. This phenomenon is easily observed by comparing the chemical shifts of protons in chloroform, dichloromethane, and chloromethane. Notice as the number of electronegative substituents increase the chemical shift of the proton is shifted downfield.
| Compound | CHCl3 | CH2Cl2 | CH3Cl |
| Chemical Shift (ppm) | 7.27 | 5.30 | 3.05 |
Electronegative substituents deshield protons by reducing the electron density about the proton. Recall that electrons shield a proton from the applied magnetic field. Due to this, the more electronegative the substituent (or the larger the number of electronegative substituents) the more deshielded the proton and the higher the chemical shift. The relative location of protons on the correlation charts below displays this phenomenon clearly.
Hybridization: The hybridization of the carbon atom to which a proton is attached (as well as the neighboring carbon atoms) affects the chemical shift of that proton. The aliphatic (hydrocarbon) region of the spectrum is generally considered to be between 0 and 2ppm. Protons attached to sp3 hybridized carbon atoms appear in this region. Within this region, protons attached to a strained ring such as cyclopropane tend to resonate at the lowest values (0-1ppm). Other protons that appear in this region include methyl, methylene, and methine hydrogen atoms. Methyl protons tend to resonate near 1ppm followed by methylene protons at 1.2-1.6ppm and followed at larger values by the tertiary methine hydrogens. Protons attached to sp3 carbon atoms with electronegative substituents or attached to an unsaturated carbon (-C=C-CH2-) will appear at much larger ppm values.
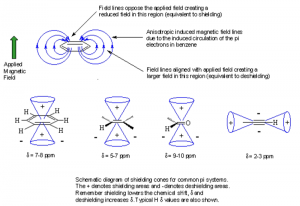
Protons attached to sp2 carbon atoms (alkene, aromatic, and aldehyde protons) resonate at higher ppm values than expected if only hybridization is taken into account. This is due to anisotropy which will be explained below. sp2 hybridized carbon atoms can be considered more electronegative than sp3 atoms due to the increased s-character of the sp2-1s bond. Protons attached to sp2 carbon atoms have less electron density since s-orbitals hold electrons closer to the nucleus. The increased electronegativity associated with sp2 hybridization is one of the factors that contributes to the downfield shift of their protons. Vinyl protons resonate in the range 4.5 to 7ppm whereas aromatic protons are found between 6 and 9.5ppm. As should be expected, aldehyde protons are found downfield of both (9 to 10.3ppm) due to the inductive effect of the electronegative oxygen atom.
Surprisingly protons attached to an sp hybridized carbon do not show up downfield of those attached to an sp2 carbon atom. This is also a result of magnetic anisotropy. Acetylenic hydrogen atoms typically appear between 1.8 and 3.1 ppm.
Hydrogen Bonding: Protons capable of hydrogen bonding are also considered to be exchangeable protons. -OH and -NH protons are the most commonly encountered exchangeable protons in NMR analysis. The location of any exchangeable proton resonance is difficult to predict because it is dependent on concentration, solvation effects, acidity and temperature. Therefore, chemical shifts of exchangeable protons are observed over a large range of values. Rapid proton exchange broadens a resonance peak, for protons with very rapid exchange the peak can become so broad it appears as part of the baseline.
It is often advisable to reserve the assignment of -OH, -NH, or any exchangeable proton resonance peak until all other peaks have been assigned.
D2O exchange: A simple way to determine if a peak corresponds to an exchangeable proton is to introduce D2O into the NMR solution subsequent to the initial evaluation. If the proton in question does exchange with its environment the deuterium atoms (from D2O) will replace the acidic protons and the peak in question will diminish and/or disappear. This is due to the following equilibrium.
ROH + D2O ⇔ ROD + HOD
Note: the amount of D2O added to solution is typically much larger than the stoichiometric amount required to complete the reaction. Due to Le chatelier’s principle the equilibrium favors the products. An HOD resonance may appear in the spectra and the ROH resonance will disappear.
Magnetic Anisotropy: Molecules that contain π electrons often have protons with chemical shifts that are impossible to explain using only electronegativity and/or hybridization arguments. The external magnetic field applied to a molecule causes the π electrons to circulate, creating a third magnetic field that affects the chemical shift of the protons within that molecule.
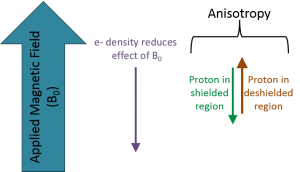 |
The three fields that affect the chemical shift of a nucleus are summarized in the figure to the left. The strength of the externally applied magnetic field (B0) determines the radio frequency required to spin-flip a nucleus. Circulating electron density around the nucleus reduces the effect of B0. Anisotropy caused by circulation of π-electrons creates shielded (reduces B0 effect) and deshielded (enhances B0 effect) regions around the molecule. |
The circulation of these electrons creates shielded and deshielded regions around the molecule. In benzene (and all aromatics) the ring current caused by the circulation of electrons creates a deshielded region around the periphery of the ring. This causes each proton around the periphery to resonate at a much higher value than expected. If a proton was placed inside, above or below the ring it would appear at a much lower value than expected due to its location inside the shielded region created by the ring current. The magnetic field caused by circulation of π electrons is called an anisotropic field. The shielded and deshielded region for several molecule types are shown below.
Practice:
In practice the chemical shift of a particular resonance can be affected by factors such as solvent, temperature, and impurities in solution. In most cases proton resonances fall within a specific range depending on the functional groups to which they are in close proximity. As you first start working to solve NMR spectra you should consult a correlation chart to aid your assignment. Two correlation charts can be viewed below. The first is more detailed than the second. As you improve your abilities you should wean yourself off of the correlation charts.
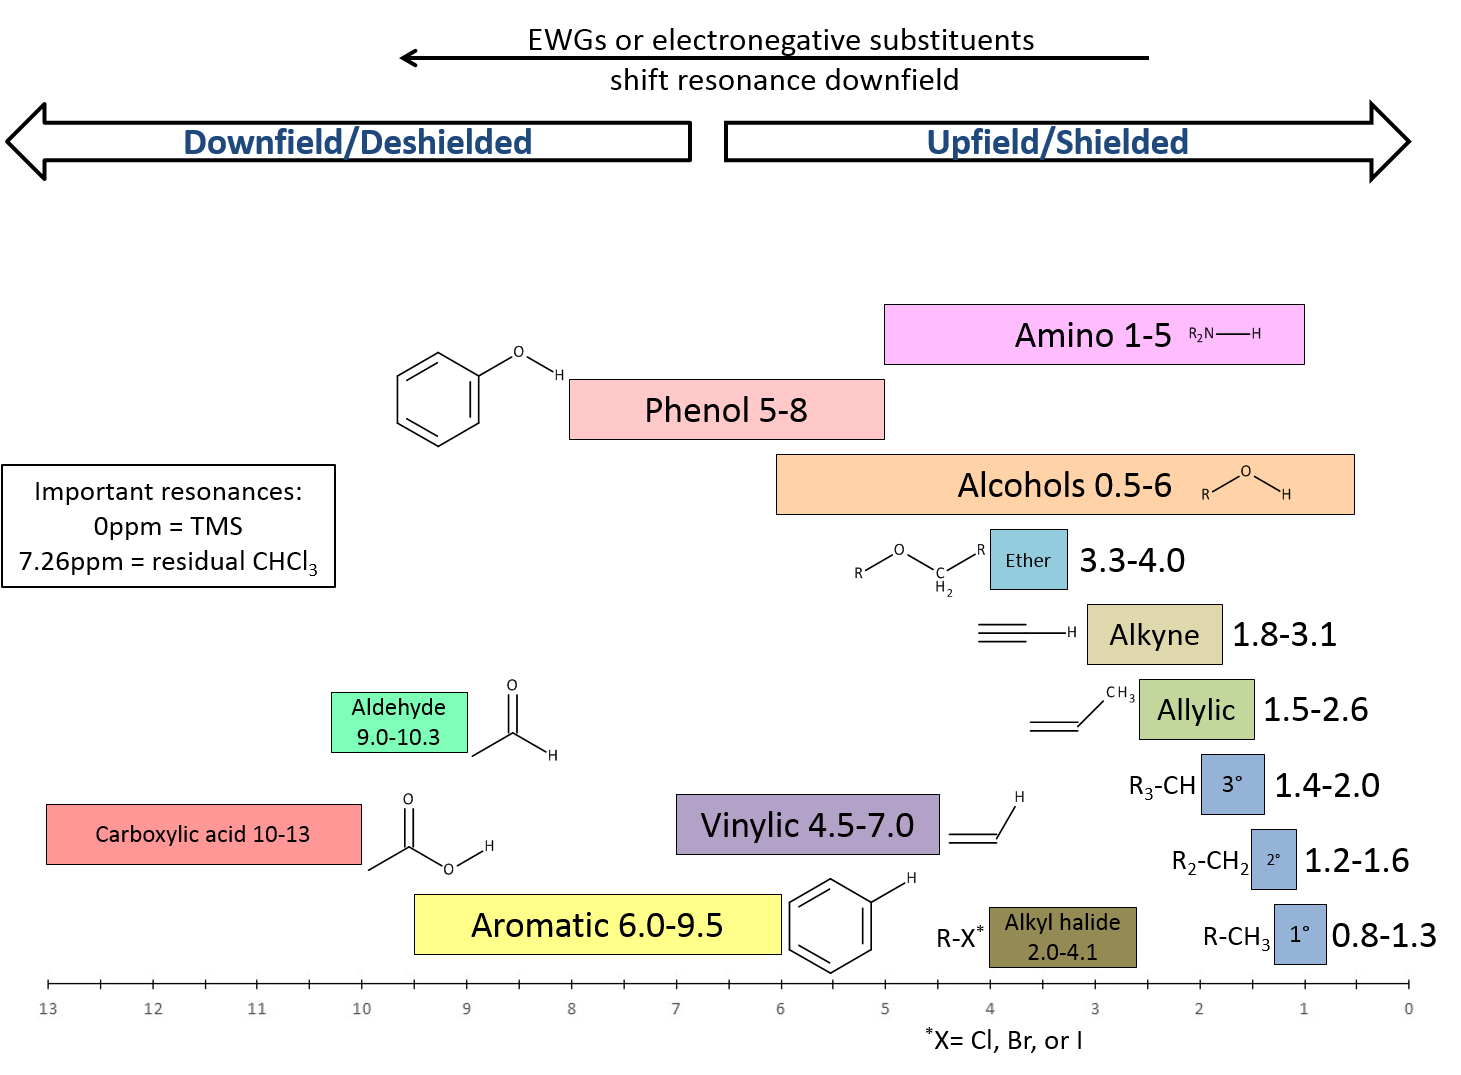
Proton Correlation Chart
For an advanced list of correlation charts you may use the following link. However, these charts are not practical to use at the undergraduate level.