Project Overview:
Under the guidance of Dr. Stephen Meriney and Dr. Rozita Langheia I assisted in the development of an accurate model of the mammalian neuromuscular junction using the MCell; a program which combines 3D models with monte carlo algorithms to observe biological physical phenomena. Accuracy was assessed by comparing concordance between the output of the model and the physiological data in three parameters; slight depression under normal conditions, facilitation under blocked/diseased conditions respectively, and probability of release.
In both the normal and the diseased conditions the model consisted of four consecutive pulses of 50 Hz, later changed to 5 consecutive pulses of 100 Hz after physiological data was reevaluated. In both models the probability of any given calcium channel to open on any given pulse remained constant and relatively low approximately 20%. The blocked/diseased condition differed from the normal condition in that a script was added to the model program that randomly closed 75% of the calcium channels on every pulse. This change lead to facilitation in that reducing the amount of calcium channels open reduced the odds that multiple vesicles would bind adequate amounts of Calcium on the first pulse however other vesicles were more likely to bind some amounts of Calcium priming them for the net pulse and thusly increasing vescicular release with each successive pulse. Contrarily the under the normal conditions multiple vesicles were more likely to bind adequate amounts of Calcium on the first pulse, however these vesicles could not be replaced in time for the next pulse thusly vesicular release decreases slightly with each successive pulse.
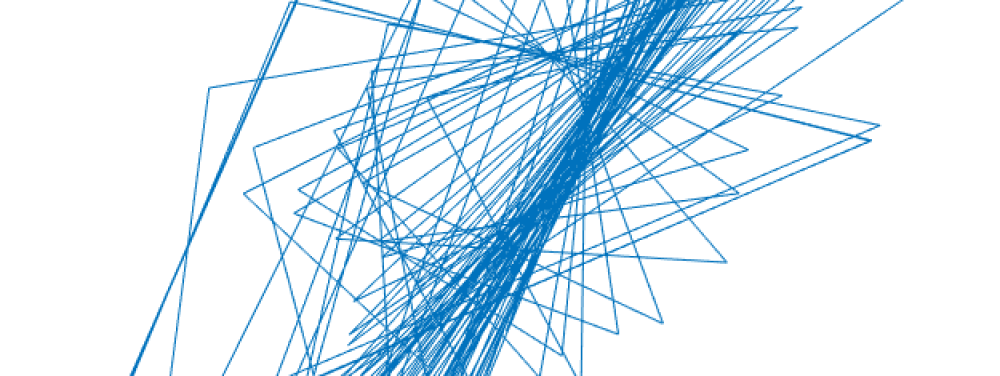
Designed using information gathered from biological imaging of in vivo mice, the model was designed using MCell and consisted of a roughly semi-spherical environment on the floor of which resided 6 active zones each with 2 synaptic vesicles and 4 corresponding calcium channels. The original model (Figure 1) featured these calcium channels aligned with the middle of each synaptic vesicle distanced by 20 nm. While this model did show slight depression under normal conditions it failed to facilitate under blocked/diseased conditions.
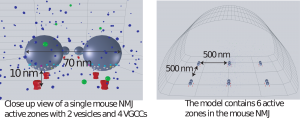
Figure 1. Original Model as it appears in MCell
From this original model I began top develop several other variations by adding a second row of channels 10 nm behind the first, some models even had three rows of channels; the third 10 nm behind the second to account for the variation is vesicle location observed in biological imaging. Within these three rows the spatial orientations of the channels were altered to create different viable models, some of which can be seen in Figure 2.
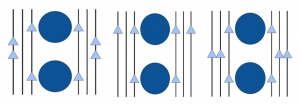
Figure 2. Examples of various channel orientations used.
Models which performed the well in the normal conditions were then run in the blocked condition. The ouput from several models in the normal condition is shown below, the physiological data is shown in black.
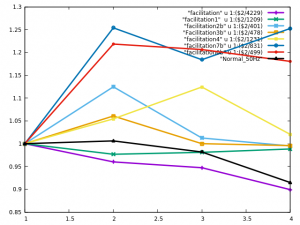
Figure 3. Output of several models in the normal condition.
After analyzing the output from some of the models I was able to discern some patterns between the more accurate models and using these patterns establish three basic considerations for assuring accurate models; channel to vesicle distance, channel to channel distance, and number of channels. The most accurate models had moderate channels to vesicle distance, averaging about 40-50 nm. As well as relatively small channel to channel distance, averaging about 30 nm. Most notably models with 4 or less channels as well as models with 8 or more channels almost always failed to show either facilitation or depression in their corresponding conditions.
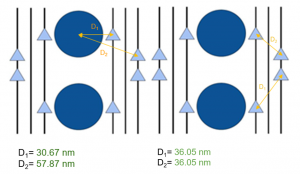
Figure 4. Vesicle to channel distances and channel to channel distances in the best performing model
Acknowledgments:
![]()

Dr. Rozita Lagheia
Dr. Stephen Meriney