Project Overview
Presently, I am working with Dr. Reynolds and Dr. Pfaffmann of Lafayette College on a model of cellular decision-making using the Notch signaling pathway. This system depends on intercellular signaling. Previously, this agent-based model using Net Logo was developed and tested, with decision-making in a population of cells driven by oscillating levels of signaling components. Using a small number of cells, I have focused specifically how the Notch agent oscillations correlate to product cell type and pattern
Methods
In order to monitor the notch levels in an accessible way I modified the system to a 19 cell macro roset (Figure 1).
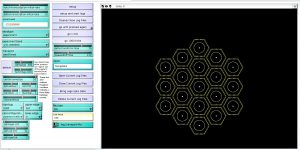
Figure 1. Interface of 19 cell roset model within the Net Logo interface
For each seed the model ran through 15,000 ticks, longer than had been observed to be required in the larger model to reach stabilization. At each tick the Notch level in every cell was recorded and outputted as a csv file within a larger data directory. I designed a script (Figure 2) to navigate this data directory system to find the Notch output files only and in these files write an axis file corresponding to the ticks. Then using the graphing software gnuplot, the program would concatenate the data for each cell with the x axis file to plot each cells Notch levels and save the resulting graph as a png file (Figure 3).
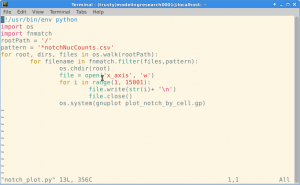
Figure 2. Script used to automate plotting of Notch levels in each individuals cells over time.
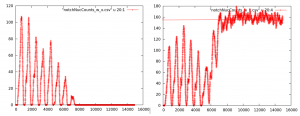
Figure 3. Output from individual cells for one seed in which the oscillations of notch levels can be seen as the cell stabilizes. Levels stabilize at 0 if the cell is a neuron as seen on the left, and at some level above 0 if the cell is epidermal as seen on the right.
Analysis of preliminary runs reveal the model stabilized in a distinct pattern, in which all the neurons were surrounded by skin cells (Figure 4).

Figure 4. Pattern of system after stabilization where red hexagons are neurons and gray hexagons are skin cells.
I observed several different trends in oscillations towards stabilization (Figure 5). We hope to investigate further how the Notch levels driving the system affects stabilization and pattern formation between neuron and skin cells. To do so I have developed several other quantitative scripts which allow for the automated computation of stabilization times for each cell determined by when the standard deviation of level of Notch consistently falls within a certain range for an arbitrary period of time. Additionally I developed a script which determined the nature of adjacent cells for each individual cell. From the data collected through these scripts we will be able to compare how stabilization time translates to pattern of cell type and how this pattern is coordinated temporally.

Figure 5. Output from three neural cells of the same system showing the differences in time before stabilization.
Currently I am working to develop other quantitative ways of accessing how the stabilization trend flows through the model and designing the requisite scripts to enact these measures.
Acknowledgements:

Dr. Elaine Reynolds
Dr. Jeffrey Pfaffmann
