
View the results in the gallery below
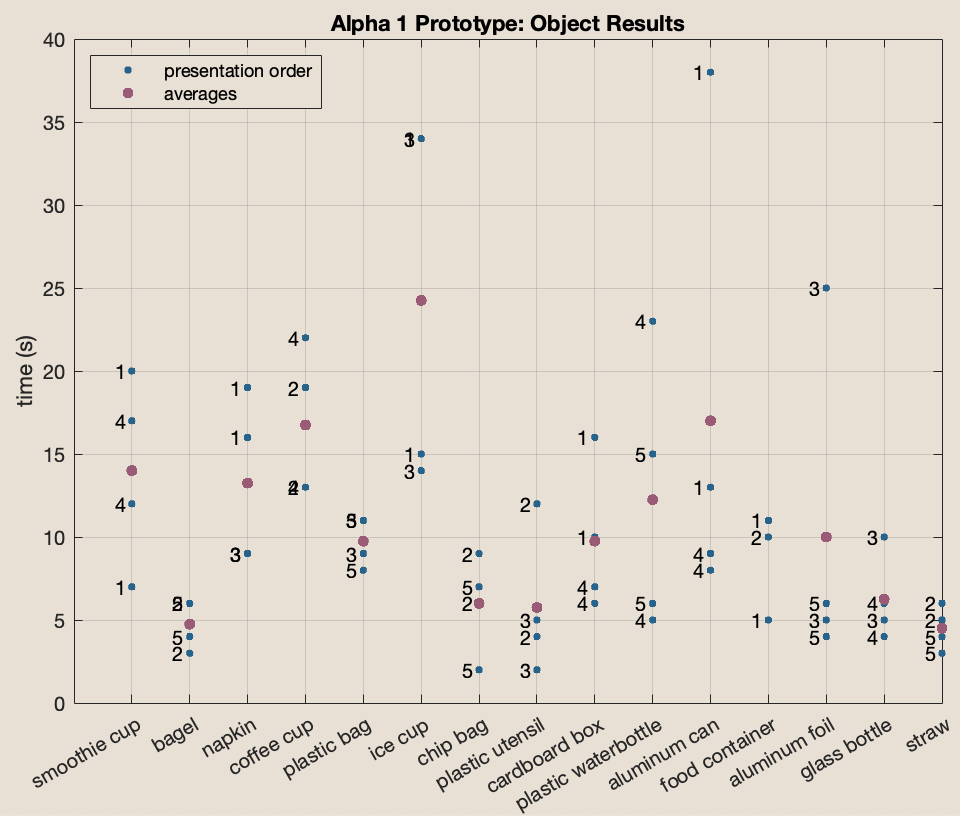
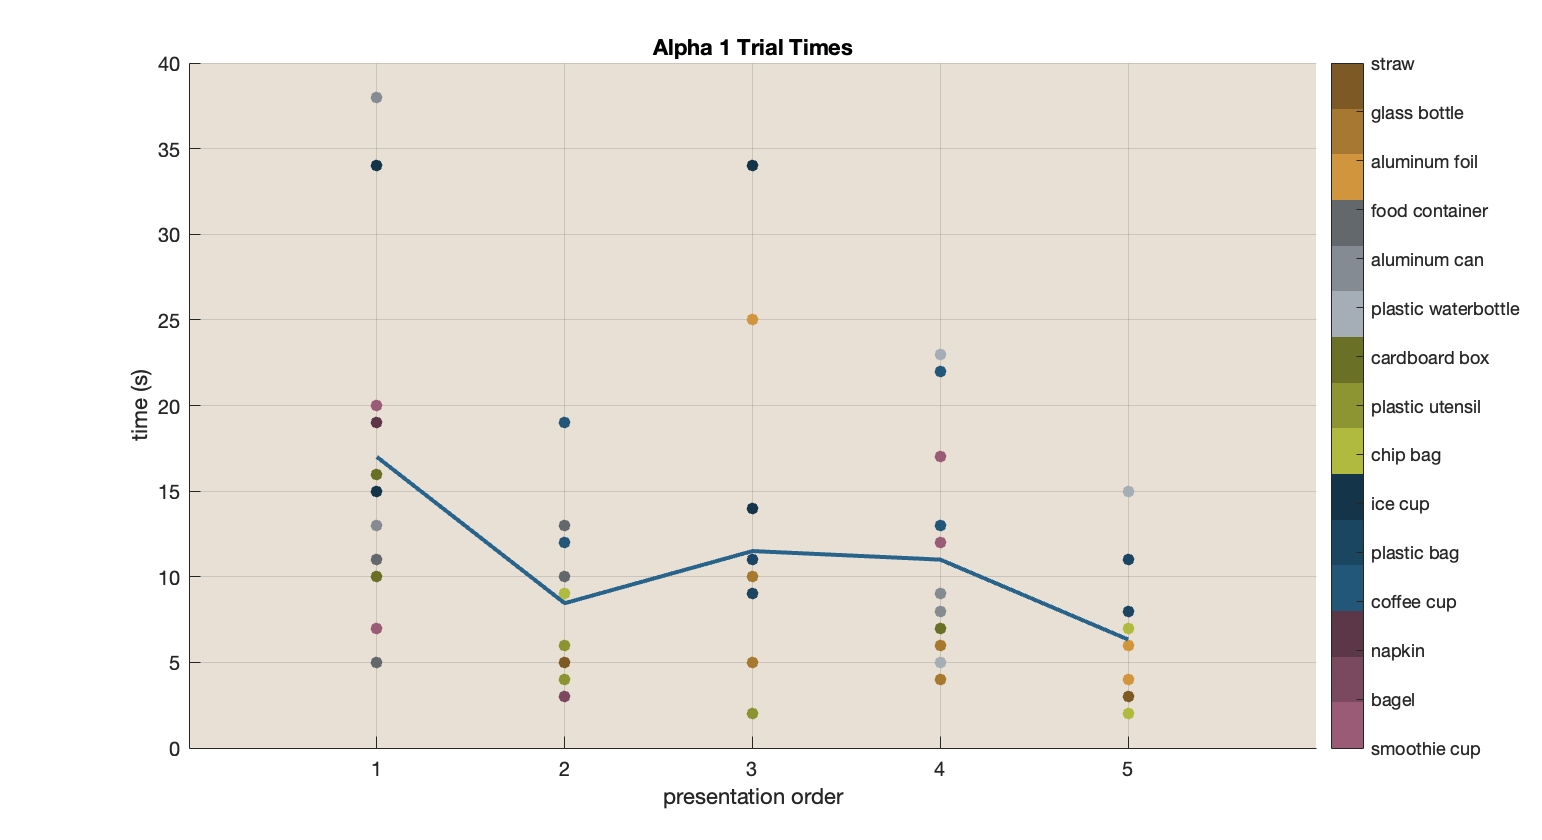
Based on our data we see that the correlation between the time spent on an object and the order the object was presented with was not significant. The objects that took the most time were the coffee cup as expected, as well as the plastic cup with ice which also was the most commonly incorrectly sorted disposable.
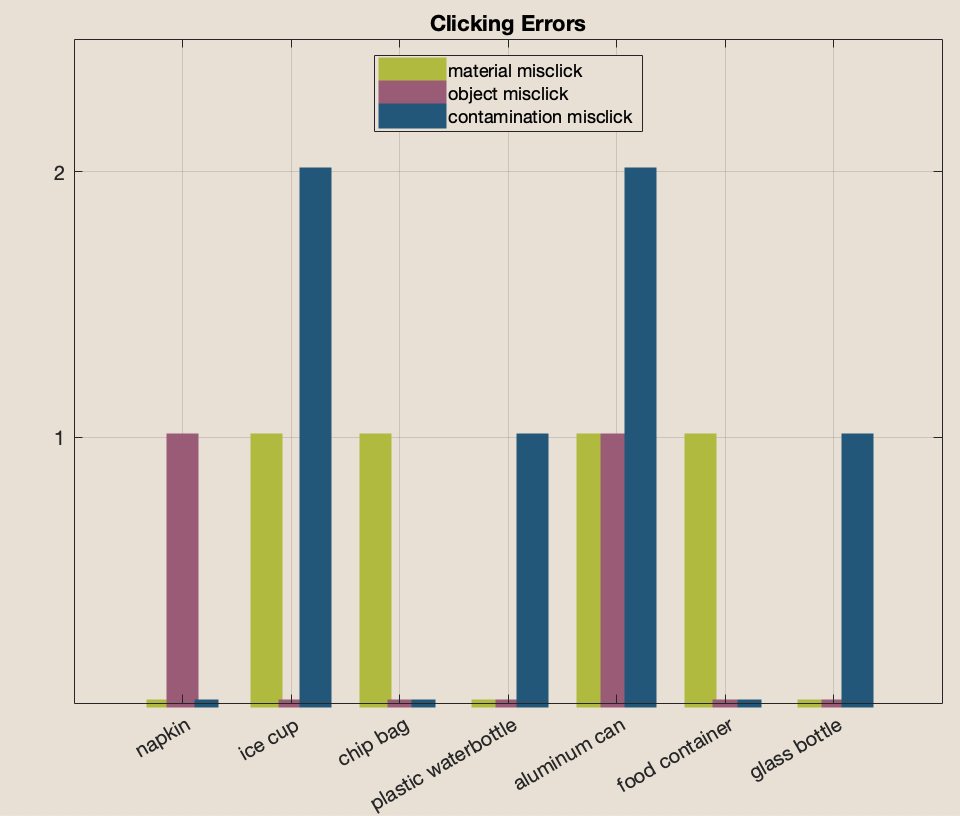
The aluminum can was a troublesome object. There was one instance of the can where it was the first object presented that was over double the average time for the object data, we took this as an outlier in understanding the prototyping system for timing, similarly, since it was the first object it is possible the user was simply familiarizing themself with the system. Ultimately there was no instance where the aluminum can ended in the wrong bin altogether.
For the plastic cup, the ice cubes did not present the same type of contamination as the smoothie on the cup, we hypothesize people were led to choose the lowest level of contamination because of their assumption of water as a noncontaminant. We decided to address this in our alpha 2 prototype to include less specific contamination images in each grouping including solids.
Overall from the alpha 1 prototype we wish to continue to educate the audience at each step.