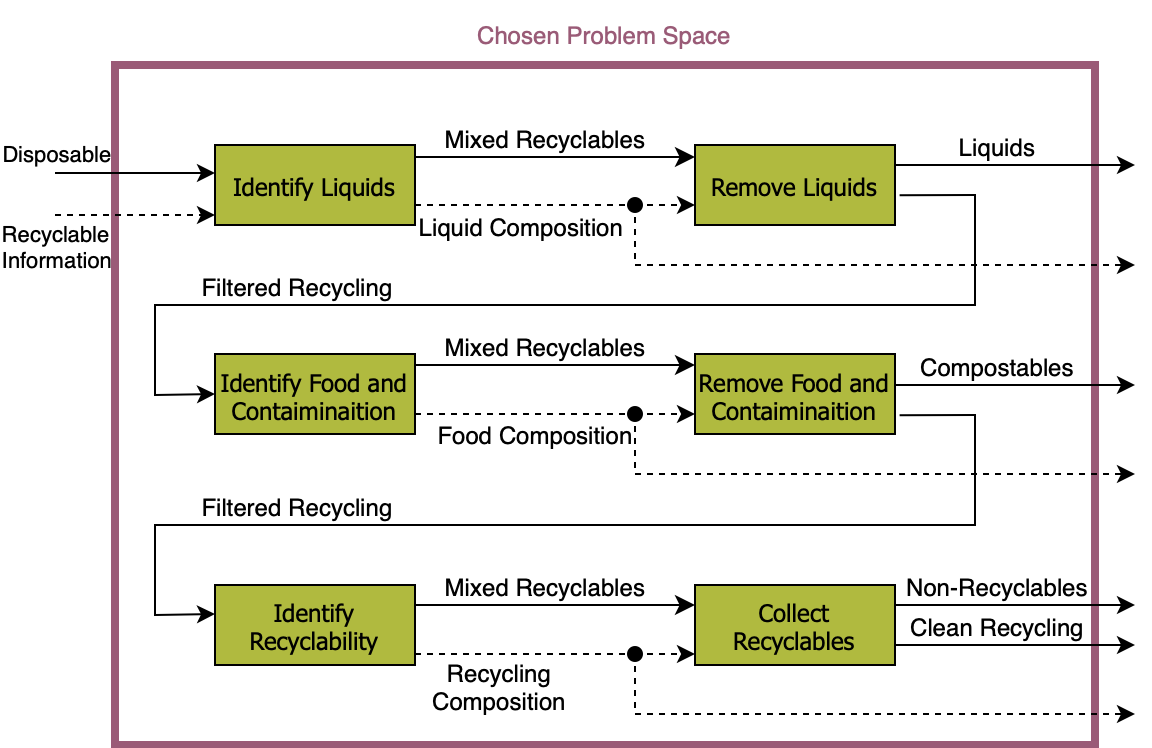
Our team used functional decomposition in two places. The first functional decomposition is of the recycling process as a whole, this flowchart helped us make critical decisions about the problem we wanted to solve.
Starting out, the input to the system is some disposable object, and the output is a recyclable product. For each block, as an object enters, some function is performed on the object and the another object or information is sent to the next step in the process. Each of these signals, the objects or information connecting the blocks, represent a state of the disposable object or some related piece of information. In small groups, we set expectations for the physical representation of each signal. We combined these expectations with representative information obtained from research detailed on the data collection page. Using the results, our group analyzed which signals have the greatest inefficiencies as compared to their expected values and from this we could bound our solution to the area around a disposable object being collected by facilities.

The solution boundaries were chosen to include the user block because we did not want to limit our ideation. By including the user our team chose to pursue a larger field of solutions which allow for ideas both preemptively guiding the user as well as correcting inaccurate decisions made.
For the second functional decomposition, we looked at the area in the purple box above, this bounds our solution space where some object enters, and the solution must have an output of the accurate streams of waste.

