
Experimentation
On Wednesday November 9th, our team conducted an experiment with part of the student body. We set up a table in Farinon Student Center from 11:00 – 1:00 p.m. with 20 items for participants to sort into either recycling or trash. Preliminarily, we talked to the Office of Sustainability to see which items were most often thrown away to include in our study.
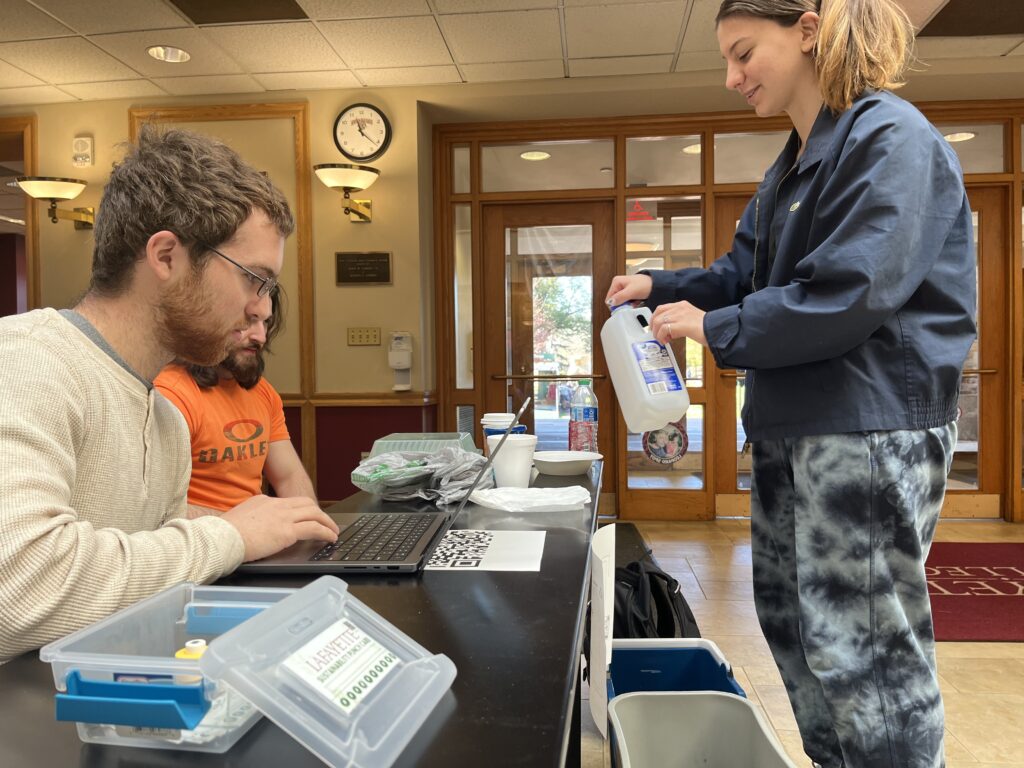
In order to collect data that accurately represented students’ normal recycling habits, we made certain decisions such as limiting the amount of time the participant had so that they felt the need to make knee-jerk reactions and we also had the standard recycling and trash cans present to see how they respond to the resources that are already available to them. We documented the outcomes and also asked them to take a brief survey about their experience. Below are some of the results from our study.
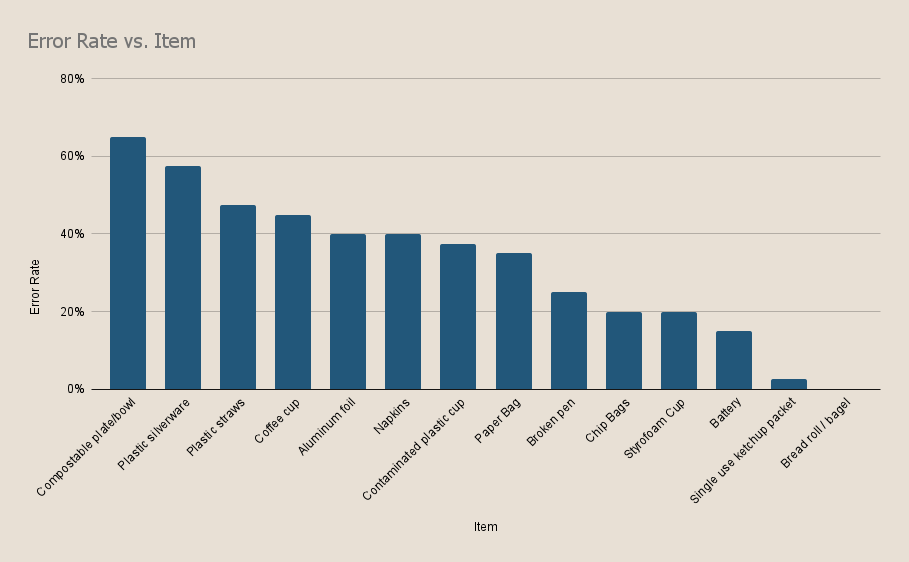
The items that were most frequently sorted incorrectly were the compostable plate/ bowl, the plastic silverware, and the plastic straw. Interestingly, 31.6% of participants commented that plastics and other recyclables were most confusing to sort. Additionally 42.1% of people said that they felt more conscientious of their decisions because people were watching them. This is a common effect that the Office of Sustainability has noticed and has tried to take advantage of during large events. This could have skewed our data since participants were thinking more carefully while they were sorting. However, the conclusion is still clear: students are confused by sorting waste and make errors even when they are dedicating more thought to their decisions.
Waste Audit
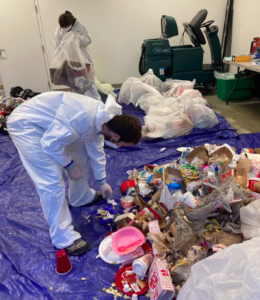
A waste audit is a formal, structured process used to quantify the amount and types of wastes being generated by a group of people. Some members of our team took part in the waste audit at the Fisher Stadium this past October.
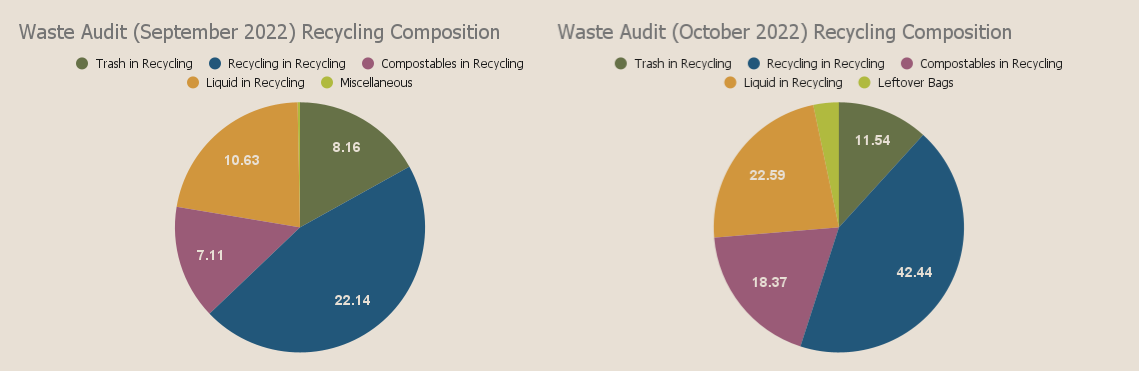
All trash and recycling from the area was collected and then initially weighed. Each bag was then emptied, correctly sorted, documented, and then reweighed. This shows how much recycling and trash there should have been if it was done correctly. A contamination rate of 48.6 percent was found in the recycling stream.
The waste audits completed in the fall 2022 semester both show similar contamination despite the location of collection. In both an athletic event setting and a residential setting the contamination rates are the same. This directs our group towards implementing a solution closer to the user of the bin system in the overall recycling system process.
Survey Data
Our team sent out a survey to gauge how students approach recycling. 73.9% of students said that the main reason they put trash in the recycling was because they lacked the knowledge of where the item was actually supposed to go. This statistic was confirmed by the fact that students admitted that they were only moderately confident in their recycling capabilities and also though that their choices have a minimal level of impact on the world.