Data Acquisition Steps:
The data acquisition for the air compressor and storage tank was taken by first fully depleting any air that was in the tank and starting at an internal pressure of zero PSI. The data that we were looking to collect for the compressor and storage tank were pressure, temperature, and the total electrical energy that the compressor consumed. Figures 1 and 2 show some of the hardware used in this data acquisition process.
For charging the compressor, we started by releasing any air from the system and then plugging it into a digital power meter. This allowed us to track the total energy consumed by the compressor as it filled the storage tank. The full run time for the compressor to charge was fifteen minutes. The pressure data was recorded at the outlet of the compressor and the internal tank pressure. The gathering of pressure data on the tank was originally meant to be taken by pressure transducers that we attached to the system with custom fittings. The pressure transducers were not used though due to issues with integrating them with the Arduino mega that we used to collect data. The issue was that when the pressure transducers were connected to the Arduino mega through an instrumentation amplifier it would cause all of our temperature readings to increase by up to 20℃ so we decided to not use the pressure transducers and go with our backup of analog pressure gages. The data from the pressure gages were collected by recording their output with video and then going back through to collect the pressure readings. Regarding the data collection of the internal tank pressure we did have a small leak percent in the system but it was only apparent at the system’s highest pressure. It took several hours for the pressure drop in the tank to be noticeable so we ended up considering this leak negligible for the time period that we were running the test. The outlet temperature for the compressor was also recorded using the same analog gauge at the outlet of the compressor. This was because a temperature gauge was integrated into the pressure gauge. The max that this gauge was able to read was 120℃ and ended up getting maxed out during the duration of the charging of the storage tank up to 175 PSI.

Figure 1: Arduino Board and Breadboard Used for Data Acquisition
The data for the heat exchanger was acquired in two steps. The first was during the charging phase of the compressor which took 15 minutes. The second was during the expansion stage when the air was released from the compressor and took 5 minutes. The sensors used to collect temperature data for the heat exchanger were one j-type and five k-type thermocouples. The J-type thermocouple was at the inlet to the airside of the heat exchanger and was inserted directly into the stream of the air. The five k-type thermocouples were all surface mounted to the copper tubes with thermal paste and insulation cork. The j-type thermocouple was run into a MAX3185 Adafruit thermocouple amplifier board where the k-type thermocouple all went to their own individual AD8495 amplifiers also from Adafruit. These were all then connected to an Arduino Mega board and data was taken at a sample rate of 5 seconds. During the charging phase of the compressor, the main data that was being taken was the inlet and outlet temperature for the heat exchanger that was on the compressor. As well as the inlet and outlet temperatures for the heat exchanger that was submerged in the water tank. After the 15 minutes it took for the compressor to charge, this data was taken and exported to an excel file and then we set up for the discharging portion. During this, the main data that was collected was the inlet air temperature and the outlet air temperature to the air motor.
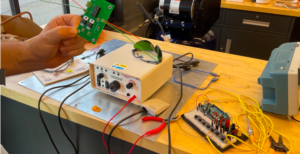
Figure 2: Elements Used for Data Acquisition Set-up
System Output Results and Analysis
We performed our output testing with the utilization of four 50W halogen light bulbs wired in series to our DC generator. To begin the test, we opened the output pressure valve on the compressor to roughly 70 psig and recorded the turbine inlet pressure, voltage, and current across the electrical system every ten seconds. The following equation was used to determine the total output power provided to the light bulb system, in which P is power in Watts, V is the voltage in Volts, and I is the current in Amps.
P = V*I Eq. 1
We then plotted the output power generated by the system against both time and outlet pressure, yielding the following graphs.
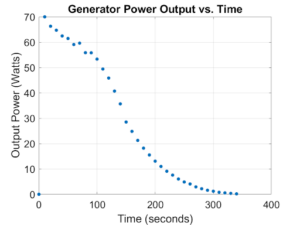
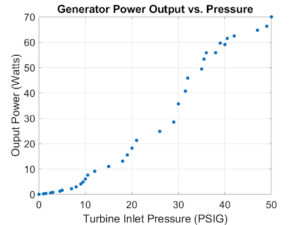
As shown, our system produced the highest output power of roughly 70 Watts at the beginning of the expansion process with a turbine inlet pressure of 50 PSIG, before decreasing as the air pressure in our compression tank dropped. Since our generator is rated for 500W and our air motor is capable of 1.8 hp (1,342W), it was concluded that our system is capable of an output power far greater than what we acquired. To achieve this, however, we would need to use a greater volume flow rate out of our compression tank, thus further decreasing the demonstration time of our system.
Integrating the output power over time gave us the total electrical energy produced by our system through one full tank of compressed air. We resulted in a total output energy of 0.0026 kWh, which is equivalent to 9.38 kilojoules. While this is our output energy, our input energy encapsulates the total energy required by the compressor and water pump to completely fill the air storage tank, which is roughly 0.4 kWh. To find the full cycle efficiency of our system, we took the ratio of output energy produced by the system to energy put into the system, resulting in a full cycle efficiency of approximately 1%.
While the air motor and generator used are relatively efficient independently, our 2-stage reciprocating air compressor is not. The compressor used, which is available for a decent price at any hardware store, is designed purely for power, rather than efficiency. Therefore, the compression process alone brings the cycle efficiency down to a maximum of 14%. In a larger-scaled system that utilized a larger, more efficient model of air compressor, we would expect cycle efficiencies between 70% and 80%, which compete with the efficiencies of the few industrial-sized compressed air energy storage systems that exist today.
Compressor Results
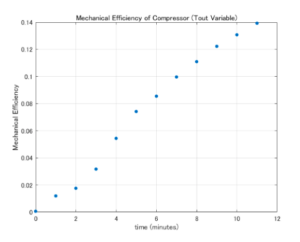
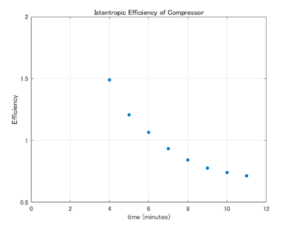
To analyze the performance of the compressor, we measured its mechanical efficiency and Isentropic Efficiency, which are seen in Figures 1a) and 1b).
 .
.
Figures 1a) and 1b): Mechanical and Isentropic of Compressor over ~11 minutes
The mechanical efficiency graph shows a steady increase from 0 to 14 percent over the course of 11 minutes. Mechanical efficiency and time seems to follow a linear positive association. This linearity of mechanical efficiency derives from the linearity of temperature over time. Temperature increasing in a linear trend tells us that air is compressed harder and harder every minute at a rate that is proportional to time. This increasing trend shows that the whole charging process is transient and does not reach steady state at any point.
Mechanical efficiency reaches a maximum efficiency of 14% throughout the charging period. This value is significantly below the lower bound value of 40% which we had listed in the specification for the compressor design. 40% is already very low, so under performing this value by 26% just shows how poor this compressor is converting energy. However, after researching and learning about compressors for a period of time, we had lowered our expectations of achieving a high mechanical efficiency. Two stage air compressors that are sold commercially at this price level are created with the sole purpose to compress air to a certain pressure level in a given pressure vessel. They are not made to be highly functionable with great efficiency. Therefore, if we were to purchase a compressor that has a higher performance (regardless of how expensive it is), we would expect the mechanical efficiency to be well above 14 %. Waiting for the compressor to reach steady state could also be an alternative method to increase the mechanical efficiency. Although, it is highly unlikely that the temperature will significantly increase after 120 C.
The Isentropic graph presents values that are physically impossible, in the earlier phase of charging. We initially thought that there was some kind of blunder in the arithmetic we used to do the calculations, but other data giving regular results proved that this was not the issue. This led us to suspect the source of error to be the data itself, or the instrumentations we used to acquire the data. We believe that the instrumentation is the main source of error, as the device is not suited well for transient behaviors. To collect the outlet and inlet temperatures, a bourdon pressure gauge with an embedded bi-metallic strip thermometer was used. These devices are great for steady state situations but for a dynamic process like this one, time lag could cause the acquisition of inconsistent data. This would lead to calculating isentropic efficiencies that don’t make sense (above hundred). However, as time increases, and the charging state approaches the end, isentropic efficiency plateaus to about 75%. This is a value that we can agree on because most compressors of this type range between 70 to 80 percent.
It is important to establish that our design project as an overall, and the compressor as a subsystem, did not have subsequent iterations that involved physical changes to the prototype. With the cost being one of the design constraints, it was necessary for the compressor team to lay out the specifications, and make sure that the compressor we purchased would definitely meet the most important requirements for the design. These specifications were the power output, pressure vessel size and air flow rate. Taking these into consideration, we made a list of compressors that would satisfy these boundary specs, and selected the one that fit well with the entirety of our design. In a sense, this design selection process was the subsequent iteration of our design. This led to the creation of our final prototype, which we have tested and obtained results. Of course, some of the specifications were not met, but it was functionable and satisfied the absolute necessity. Now that we know that our compressor does a terrible job at being efficient, it is the future team that needs to make use of this result and implement it in their future design.
Heat Exchanger Results
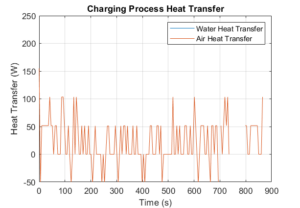
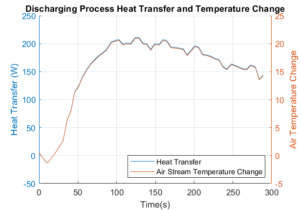
Figure 1: Heat Transfer for Charging Process Figure 2: Heat Transfer For Discharge Process
While conducting testing for our prototype, we were able to produce results specific to our heat exchangers. We generated plots showing heat transfer and temperature data for the charging and discharging process. Figure 1 shows the amount of heat transfer occurring for the charging stage where we pressurize the compressor’s tank. The plot has a lot of noise; this is because we have small heat transfer values that are difficult to measure. The temperature differences are small, within a few degrees Celsius, that make it difficult for the thermocouples to detect. We could improve this data with better instrumentation and a more thorough calibration. In Figure 2, heat transfer and temperature data is shown for the discharge process. Initially, there is a dip where the air flow from the warmer tubing hasn’t made it through the heat exchanger system. As the air moves from the compressor’s tank through the 3rd heat exchanger, we see an increase in heat transfer from water in the thermal tank to the air stream. Heat transfer decreases as the discharge time increases because the air mass flow rate starts to decrease. The temperature change of the air stream is also recorded on this plot and follows the trend of the heat transfer, scaled down by a factor of the air mass flow rate.
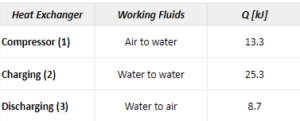
Table 1: Energy Transfer for Heat Exchange Processes
The table (Table 1) indicates that the energy transfer, in kilojoules, from the charging stage does not equal the energy transfer during the discharge stage as expected under an adiabatic assumption. This loss comes from the lack of precision in our temperature measurements and from heat lost to the surroundings. The values in the table are positive indicating that our heat exchanger systems are capable of increasing the power output of our overall system.
