Automated Parking Garages

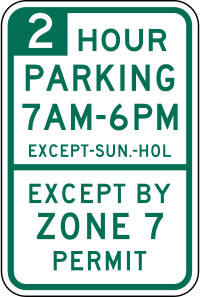
A major problem experienced by transportation planners wherever space is limited is parking. As transportation becomes easier and more and more people use their vehicles to get around, there has to be space to store these vehicles when not in use. The typical solution is to build a parking lot, however when space is limited this is rarely efficiency enough. A better choice is a conventional parking garage; however their efficiency is limited by the space that needs to be left for cars to make their way in and out. The solution to this issue has been the creation of automated parking systems (APS).

History

Automated parking was first constructed in 1905 in France, however the technology did not see significant usage until the 1970’s. These early systems were prone to mechanical failure and usually increased the amount of time required for drivers to park and retrieve their car. Japanese builders constructed some of the first and most successful systems during that time, as they worked to make the most of the small land area they had available. Interest in the US was limited until late in the 1990’s when the technology had developed enough to lower the likelihood of mechanical errors. In addition to being more space-efficient, these new systems also had a number of other benefits  such as keeping the parked vehicles more secure, and protecting them from damage from careless drivers. One example of a modern automated parking system can be seen in Philadelphia, where designers have created an extremely efficient system to serve their parking needs.

While the concept still feels bizarre to me, I am sure that parking systems such as this will see more and more usage as development continues and land becomes more and more valuable, especially in congested cities such as New York.

Sources:

  • http://en.wikipedia.org/wiki/Automated_Parking_System

Images:

  • http://en.wikipedia.org/wiki/File:SDOT_R7-108P.svg

I-95 Construction


On my way back to Lafayette last weekend, I got to experience firsthand the issues that can be caused by our aging infrastructure. My bus ground to a halt was we made our way through new haven, stopped by miles and miles of construction related congestion. The upside of this situation, however, was I had plenty of time to search the internet and find out just what this slowdown was all about.

Pearl Harbor Memorial Bridge

The backup I was stuck in were the result of an ongoing project to replace the Pearl Harbor Memorial Bridge, which spans the Quinnipiac River (hence the nickname “Q” Bridge) in New Haven The old bridge, opened in 1958, carries 3 lanes in each direction and is loaded far beyond its capacity. The new bridge, under construction now, will carry 6 lanes in each direct and serve a vastly improve ramp network surrounding the bridge. This project will have huge positive impacts on the traffic flow through new haven, however the closures and detours required for the project’s completion will cause significant problems in the meantime. The role of transportation engineers in planning each phase of construction and how the closures will be implemented in clearly huge. The video below talks more about just a few of the hurdles they are overcoming in completing the bridge. The project is set to be completed in 2016.

Sources:

  • http://www.i95newhaven.com/
  • http://en.wikipedia.org/wiki/Pearl_Harbor_Memorial_Bridge_(Connecticut)

Images:

  • http://en.wikipedia.org/wiki/File:Seal_of_the_Connecticut_Department_of_Transportation.svg

HOV Lanes

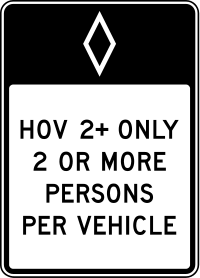
One interesting method for reducing congestion on heavily travelled highways is the use of a High Occupancy Vehicle lane, or HOV lane. These lanes typically require a minimum of two or three occupants in the vehicle, which encourages carpooling and decreases the total load on the roadway.

History

The first HOV lane in the US was implemented in 1969 outside Washington DC. Initially, the lane served only busses but four years later in 1973 it was opened to carpools with 4 or more occupants. Following this first HOV lane’s introduction, implementation slowly increasd across the country, with the greatest usage occurring in and around major metropolitan centers such as New York, Boston, San Fransisco, and Los Angeles. Ride-sharing also became a recommendation of the EPA under the clean air act, further driving increased usage of HOV lanes. Currently, California leads the US with 88 HOV facilities across the state.

Usage and Effectiveness

HOV lanes are implemented in a variety of ways. Some HOV systems are simply a lane within an existing roadway with special marking (usually a white diamond) to differentiate it from the surrpunding lanes. More commonly, the HOV lane is separated from other traffic, as the difference in speed between HOV traffic and regular traffic can pose a safety risk. Where separate lanes are not available but are required, some agencies operate a system with moveable barriers, allowing HOV traffic to run on the un-congested side of the highway during peak flow times. May HOV systems are reversible in this way, allowing them to always operate in the direction of highest demand.

The effectiveness of HOV lanes is often disputed. Every so often, a story makes the news about someone’s absurd scheme to ride in the HOV lane with cadavers or blow-up dolls as additional occupants. While the premise of the HOV lane is a good one, the thought that people will simply give up driving alone for the company of complete strangers is not reasonable. Just as with public transportation, it is tough to draw people away from the convenience of their own cars. Additionally, HOV lane travel is option only marginally faster than the general speed of traffic, and if a one-lane HOV system experiences an accident, the system is essentially shut down. While I do believe that HOV lanes are a useful element of our transportation systems, I do not think their effectiveness is great enough to continue their usage as a traffic congestion solution

A “Zipper” machine moving barricades for a reversible HOV lane

Sources:

  • http://en.wikipedia.org/wiki/High-occupancy_vehicle_lane
  • http://www.dot.ca.gov/hq/traffops/systemops/hov/hov_sys/

Images:

  • http://en.wikipedia.org/wiki/File:MUTCD_R3-10.svg
  • http://www.hawaiihighways.com/H1-zipmobile.jpg

E-ZPass

Our recent discussions of queuing in class have made me think a lot more about examples of queuing within transportation systems we frequently use. One queuing-related technology that is especially interesting to me is E-ZPass. As you probably know, this is an electronic toll collection system used throughout the northeast which relies on wireless technology to read transponders placed in cars through the toll plaza. Conventional E-ZPass installations have been very successful at decreasing wait times at toll plazas, with further decreases in congestion possible through the use of high speed E-ZPass lanes, which can collect fares at near highway speed.

History

The first electronic toll collection system was implemented in Colorado in 1991. Around this same time, various toll collection agencies in and around the city of New York were working to develop their own electronic toll collection system to decrease congestion on some of the most heavily travelled roadways in the united states. The E-ZPass system was first deployed in 1993, and saw rapid expansion of usage following that time. Many other states in the northeast such as Massachusetts and Maryland created similar systems soon after and over time they were modified for inter-compatibility. Following the rebranding Massachusetts’s “Fast Lane” system in 2012, all electronic toll systems in the northeast operate under the E-ZPass brand.

How the E-ZPass system works

Benefits

The primary benefit from the use of E-ZPass is the decrease in congestion at toll plazas. Instead of waiting for an attendant to process the transaction, or for the driver of the vehicle to fumble around for exact change, drivers can pass directly through the toll at between 5 and 15 mph, without having to take their hands off the wheel or focus on anything except driving. This means that less attendants are required, decreasing the cost to toll agencies. The wait times are further decreased in areas where high speed E-ZPass lanes are used, which allow cars to pass through the plaza at near highway speeds. This allows the toll plaza to meet the demand of customers no matter what the demand volume might be. While decreased congestion is the most obvious effect, the decrease in pollution and savings in gas that result from less vehicles waiting at the toll. Hopefully in the future these systems will be built into cars or license plates, so that every car on the road can use this electronic toll system. If all cars on the road were using this, we could eliminate the costs associated with staffing toll plazas, excessive vehicle idling, and other costs that long waits cause.

Sources:

  • http://www.e-zpassiag.com/
  • http://en.wikipedia.org/wiki/E-ZPass
Images:
  • http://www.e-zpassiag.com/images/about_us/lane.gif
  • http://en.wikipedia.org/wiki/File:EZPass_logo.svg

I-35W Bridge Collapse

On August 1, 2007, the I-35W Mississippi River Bridge in Minneapolis, MN failed in one of the most dramatic displays of faulty engineering in recent memory. The bridge experienced a catastrophic collapse that killed 13 and injured 145. In addition, the bridge collapse closed a major vehicular link to the city of Minneapolis for over a year, causing major impacts on transportation in the area.

Background

Built in 1964, the I-35W Bridge was a key portion of the Twin Cities freeway system. The bridge used steel trusses for support, and spanned the entire width of the river in one arch to allow the river channel to remain navigable for boats passing below. The bridge frequently received low ratings following inspections and showed increasing signs of structural instability as it aged. The bridge also suffered from frequent buildup of black ice, resulting in many accidents in the winter months. In early 2000, the bridge was fitted with a black ice prevention system that sprayed a liquid agent onto the road surface, preventing these accidents. It has been argued that this system may have contributed to the bridge’s failure.

Collapse

Cars abandoned on the collapsed bridge. They were numbered as part of the investigation.

A number of factors contributed to the collapse of the bridge. Primarily, it was found that undersized gusset plates used in construction became critically overloaded as the bridge was resurfaced and the dead load increased. Additionally, over 500,000 pounds of construction material and equipment was present on the bridge during its collapse, which exacerbated problems with the overloaded gusset plates. A massive effort was required to rescue the victims of the collapse while still maintaining the integrity of the site so that the cause of collapse could be determined. It took over a year of analysis and testing for the final cause of collapse to be determined.

Effect on Transportation

The collapse of the bridge had massive effect on transportation in the area. While the bridge carried only vehicular traffic, it also impacted or halted river, rail, bicycle, pedestrian, and air travel in the area. The river was closed to navigation in the area as the debris filled water was impassible for boats. A portion of the bridge fell onto a rail spur adjacent to the river, closing rail access to that line. The Grand Rounds National Scenic Byway bike path was impacted by the collapse, and the FAA created a 3 mile radius of restricted airspace around the accident site. Additionally, a secondary bridge located just a block downstream was closed to all non-emergency traffic for a month following the incident. The ripple effect that the failure of one element can have on a larger transportation system is incredible.

Although a replacement bridge was built in just over a year, massive changes were necessary to supplement the missing bridge while repairs were underway. Trunk Highway 280, a nearby road, was temporarily converted to a freeway by closing all cross roads along its length. Other local highways were repainted to increase the number of lanes and modified to remove choke points. Extra busses were added and commuters were encouraged to take public transportation or seek alternate routes. Thankfully, it took only a year to construct the replacement bridge, allowing for restoration of the existing transportation system and a return to normal for drivers. The effects of the collapse will not soon be forgotten however. The I-35W Bridge collapse is a great look at our reliance on transportation systems and the consequences of their failure.

The new bridge, as seen from below

Sources:

  • http://en.wikipedia.org/wiki/I-35W_Mississippi_River_bridge

Images:

  • http://en.wikipedia.org/wiki/File:I35W_Collapse_-_Day_4_-_Operations_%26_Scene_(95).jpg
  • http://en.wikipedia.org/wiki/File:Under_the_35W_Bridge.jpg

The Big Dig

MHS LogoLiving in Massachusetts, one topic related to transportation engineering that has always been of great interest to me is the Boston Central Artery/Tunnel Project, more commonly known as the Big Dig. Completed in 2007 after 25 years of planning and work, the primary purpose of this massive project was to move the Central Artery (Interstate 93) from an elevated highway to a tunnel under the city of Boston. Costing in excess of $14 billion, it is the most expensive highway project in US history, and its cost will likely continue to rise as a result of flaws in construction.

The Need

The Big Dig was created to solve the problem of extreme traffic congestion on the Central Artery. The elevated highway, constructed in 1956, was initially designed to carry 75,000 vehicles per day. By the early 1990s, it carried over 200,000 vehicles per day, resulting in massive traffic jams. It was estimated that if no changes were made, the central artery would experience 16 hours per day of stop and go traffic. Additionally, the overloaded elevated highway was not aesthetically pleasing and contributed greatly to air and noise pollution in the city. Clearly, the need for change was great.

The Obstacles

Big Dig Slurry Walls

Slurry walls supporting the elevated highway while work continues below

In order to make the project a success, many different issues had to be considered. Hundreds of traffic studies had to be performed to ensure that the new construction could handle both current demand as well as the increased loads that would be present in the future. Traffic speed and behavior had to be carefully analyzed to ensure safety and efficiency in the tunnels, in addition to careful consideration of the role of mass transportation within the new transit system. The environmental impact of the project also had to be carefully considered and offset where necessary. By far the greatest challenges came with the actual construction however. The whole project had to be completed without closing the central artery, disrupting the city of Boston and its related services, or interrupting the numerous other transportation systems in the area. Additionally, the historic nature of the construction area required special considerations when artifacts or other features where discovered. State of the art construction techniques such as slurry-wall construction and artificial ground freezing had to be employed to ensure success of the project.

The Result

The Big Dig is far from perfect. It was completed 9 years late and $8 billion over budget. Additionally, the infrastructure has suffered from myriad of problems such as sub-standard concrete failures, tunnel leaks, a fatal ceiling collapse, and the deterioration of light fixtures, wall panels, and other metal hardware.  Still, there have been many benefits as a result of the project. Traffic congestion has been decreased by as much as 60%, along with significant decreases in air and noise pollution in the city. The space previously occupied by the elevated highway has been replaced with an urban park system, increasing quality of live and providing a venue for public art. The creation of more mass transit has decreased emissions in some areas and allowed for increased expansion of the city. While far from perfect, the Big Dig is a fascinating case of how transportation engineering can have a massive effect on the everyday lives of people.

Construction Area

A simple map of the Central Artery/Tunnel Project

Interesting Facts and Figures

Copied from http://www.massdot.state.ma.us/highway/TheBigDig/FactsFigures.aspx

Traffic

  • The elevated Central Artery had just six lanes. The new underground expressway has eight to ten lanes.

Dirt

  • The project excavated a total of 16 million cubic yards of dirt, enough to fill a stadium to the rim 16 times.

Concrete and steel

  • The project placed 3.8 million cubic yards of concrete, enough to build a sidewalk three feet wide and four inches thick from Boston to San Francisco and back three times.
  • Reinforcing steel used in the project would make a one-inch steel bar long enough to wrap around the earth at the equator.

First, most, biggest

  • The project’s seven-building ventilation system is one of the largest highway tunnel ventilation systems in the world.
  • The Leonard P. Zakim Bunker Hill Bridge is the widest cable-stayed bridge in the world and the first hybrid and asymmetrical design in the United States, using both steel and concrete.
  • The project included the largest geotechnical investigation, testing and monitoring program in North America. The purpose was to identify conditions in the path of tunneling work, and help prevent buildings from settling during the digging.

Parks and open space

  • The project created more than 300 acres of new parks and open space, including 27 acres where the existing elevated highway stood, 105 acres at Spectacle Island, 40 acres along the Charles River, and 7 acres as part of an expanded Memorial Stadium Park in East Boston.
  • More than 2,400 trees and 26,000 shrubs were planted at Spectacle Island. Another 2,400 trees and more than 7,000 shrubs were planted downtown.

Environment

  • Because of the new highway system, Boston’s carbon monoxide levels dropped 12 percent citywide.

Sources:

  • http://www.massdot.state.ma.us/highway/TheBigDig.aspx

Images:

  • http://en.wikipedia.org/wiki/File:Mhs_logo.png
  • http://en.wikipedia.org/wiki/File:BigDigSupportsCentralArtery.agr.jpg
  • http://en.wikipedia.org/wiki/File:Boston-big-dig-area.png

Welcome to “Braking” News

Welcome to Braking News, my blog for CE 341. This will be updated throughout the semester with all sorts of transportation related things. Since this is a transportation engineering blog, I figured that it would be good to start out by talking about what engineering, civil engineering, and transportation engineering are.

What is engineering?

Plans
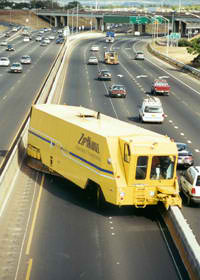
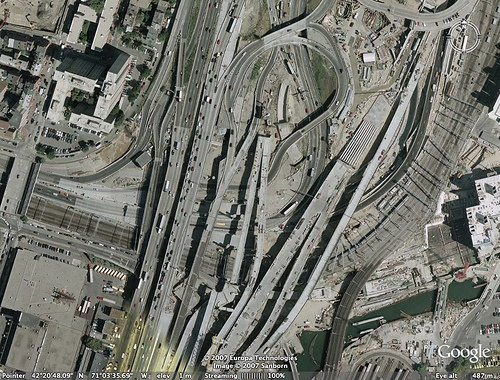
The dictionary tells us that engineering is “The branch of science and technology concerned with the design, building, and use of engines, machines, and structures”. While this definition might be satisfactory to some, there is much more to engineering than one simple sentence can describe. This brief definition leaves out one of the most critical parts of engineering in my opinion; problem solving. Sure engineers design, build, and use all sorts of things, but we also spend a huge about of time troubleshooting the things that are already built that don’t work right, or that could be improved. We look to improve the usability, efficiency, and sustainability of things that do work right, but could be better. Engineers also analyze the impact of our work on other engineered items, on the general population, and on our world. Additionally, the dictionary’s definition of what engineers design, build, and use is totally oversimplified. In fact, I don’t think it would be a stretch to say that engineering is involved in the design, construction, and use of everything. If an engineer hasn’t been involved in the creation of a certain product or item, chances are it isn’t going to work the way it is intended. Engineering is a discipline that can be found everywhere, and drastically impacts our lives every day.

What is civil engineering?

Engineers surveyingCivil engineering is a subset within engineering that deals primarily with infrastructure. This includes roads, bridges, buildings, utilities, railways, ports, tunnels, and much more. The name, civil engineering, comes from the early separation between engineering for the military, and engineering for civilians. Almost everything that civilians use each day, the infrastructure that is critical to our society as we know it is the responsibility of civil engineers. We also focus a great deal on managing the use of the systems that we build, from traffic control to water resource management. Civil engineers work to ensure not only that the systems that our population requires are in place, but also that they are functioning as intended and in an efficient manner. Civil engineering has a number of sub disciplines that focus on specific areas of the civil engineering field. Each sub discipline plays an important role in the overall field of civil engineering.

What is transportation engineering?

Transportation engineering is the study and planning of transportation systems. Transportation engineers analyze the transportation needs of a specific population, and design and construct the system that is most appropriate for that population. They also analyze existing built systems to enhance their efficiency and maintain their usability. Airports, roads, rail lines, ports, and all the machines that use these facilities are all the concern of transportation engineers. Additionally, transportation engineers study and design systems concerned with active transportation, which includes more basic forms of transportation such as walking or biking. Transportation engineers must work with a range of other engineering disciplines in order to create effective and efficient transportation systems that can be used by the population they are designed for. Transportation engineers must also work with policymakers to gain public approval for most, if not all projects that they typically undertake.

Complex highway